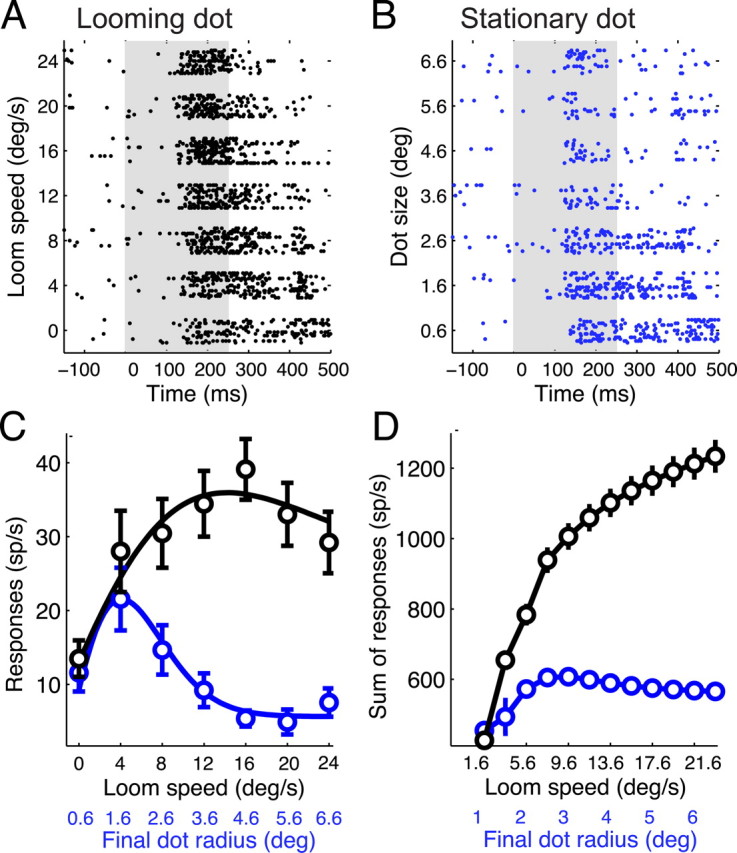
Figure 1.

Neuronal responses to looming and stationary dots. A, Raster display of OTi-d neuronal responses to looming, black dots of different loom speeds. The duration of the stimulus, indicated by the gray box, was 0–250 ms. B, Raster display of responses of the same unit to stationary, black dots of different sizes (radii). The sizes tested correspond to the final dot sizes for each of the loom speeds tested in A. The duration of the stimulus, indicated by the gray box, was 0–250 ms. C, Neuronal responses to loom speed and dot size (black and blue circles, respectively, shown as mean ± SEM) obtained from A and B by counting spikes from 0 to 400 ms after stimulus onset and converting to spikes per second. The curves are difference of Gaussian models that fit best to the data (see Materials and Methods). Loom speeds and the corresponding final dot sizes are indicated along the x-axis. The maximum suppression (response at largest dot size or loom speed/peak response) in both curves is at the 10-percentile value of the respective distributions of maximum suppression (n = 19 sites). D, Total number of spikes (per second) in response to looming dots (black curve) and stationary dots (blue curve), calculated from a population of 19 sites at which both types of stimuli were tested. The error bars indicate the SE, estimated by applying a bootstrapping procedure with 1000 resamplings.
