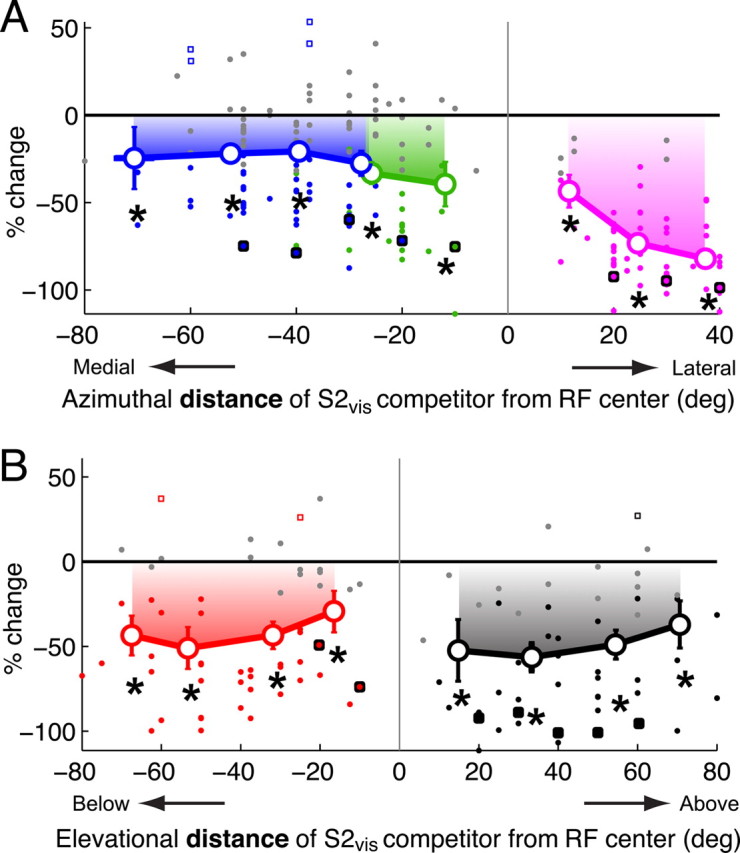
Figure 5.

Population summary of the spatial profile of the effect of a visual competitor on responses to a visual stimulus centered in the RF. A, Summary of the effect of the azimuthal position of a looming visual stimulus (S2vis) located outside the RF on responses to a weaker looming visual stimulus (S1vis) presented near the RF center (n = 33). Responses are shown as percentage changes (mean ± SEM) with respect to the responses to S1vis alone, and are plotted as a function of the azimuthal distance of S2vis from the RF center. Only locations that were outside the RF (i.e., locations at which single stimuli did not drive responses; Materials and Methods) were included. Positive values of distance represent locations lateral to the RF center; negative values represent locations medial to the RF. Filled dots indicate data from individual sites; large open circles indicate the average effect (see Materials and Methods); gray dots indicate individual data that were not significantly different from 0 (see Materials and Methods); squares with black borders indicate the data from the example site in Figure 4. Locations lateral to the RF are shown in pink, those medial to the RF center and up to 15° into the opposite hemifield (represented on the same side of the brain) are shown in green, locations >15° into the opposite hemifield (represented on the opposite side of the brain) are shown in blue. Asterisks indicate significant response suppression (p < 0.05, see Materials and Methods). B, The effect of the elevational position of a looming visual stimulus (S2vis) located outside the RF on responses to a weaker looming visual stimulus (S1vis) presented near the RF center (n = 24). Same conventions as in A. Positive (negative) values of distance represent locations above (below) the RF center. Asterisks indicate significant response suppression (p < 0.05, see Materials and Methods).
