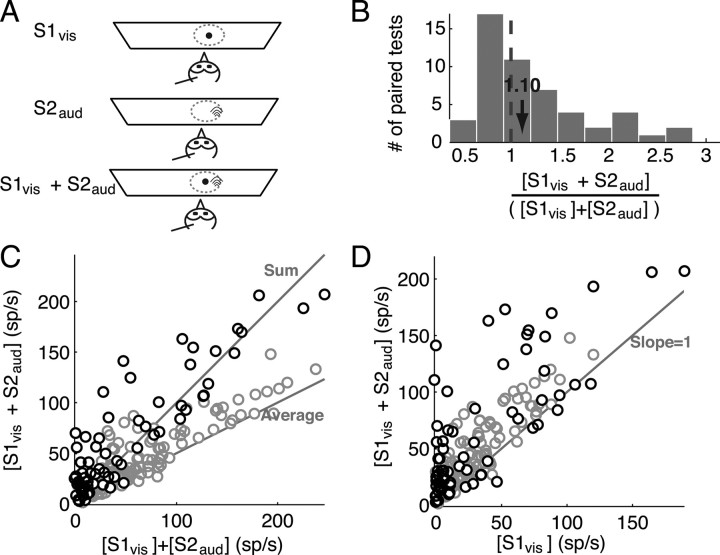
Figure 6.
Responses to paired visual and auditory stimuli inside the RF. A, Schematic representation of the experimental set-up. S1vis (small black dot) was a looming stimulus presented at the RF center, and S2aud (black arcs) was an auditory stimulus presented inside the auditory RF. B, Distribution of the ratio of responses to a pair of visual (S1vis) and auditory stimuli (S2aud) presented simultaneously inside the RF to the sum of the responses to each stimulus presented alone for all paired tests (n = 14 sites; 69 paired-stimulus tests). The properties of S1vis and S2aud are given in the text. C, Responses to the paired visual (S1vis) and auditory stimuli (S2aud) plotted against the sum of the responses to each stimulus alone. The data indicate mean values. The lines along which the data points would fall if the responses to [S1vis + S2aud] were equal to either the sum or the average of the individual responses are indicated. Responses to two visual stimuli presented inside the visual RF (Fig. 2C) are reproduced for comparison (gray circles). D, Responses to the paired visual (S1vis) and auditory stimuli (S2aud) presented simultaneously plotted against the responses to S1vis alone. The line along which the data points would fall if the responses to S1vis and S2aud were equal to the responses to S1vis alone is indicated. Responses to two visual stimuli presented inside the visual RF (Fig. 2D) are reproduced for comparison (gray circles).

