Figure 9.
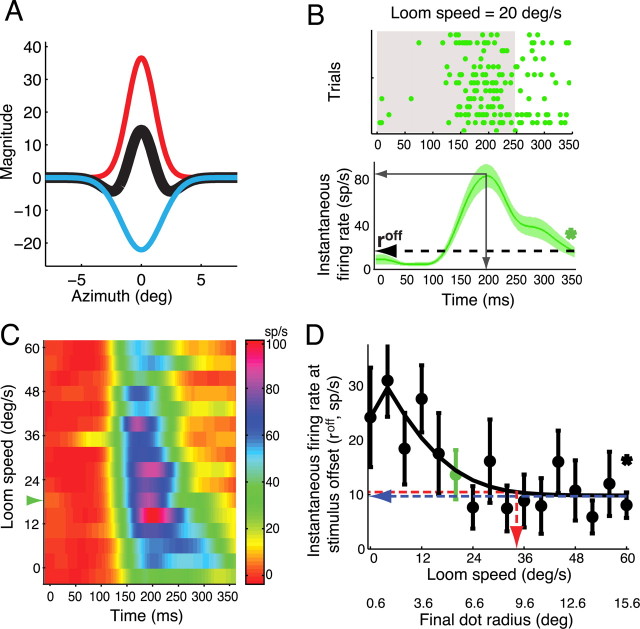
Classical inhibitory surrounds of OTi-d neurons to stationary and looming dots. A, Excitatory (red) and inhibitory (blue) Gaussians obtained from a difference of Gaussians fit to the responses in Figure 1B, and the summed “Mexican hat” function (black). The radius of the local inhibitory surround for this unit estimated with stationary dots was 4.4°. B, Top, Raster display of unit responses to a looming stimulus of speed 20 deg/s (same site as in A and Fig. 1). Bottom, Mean and SEM of instantaneous firing rates from the raster (see Materials and Methods). The dashed arrow indicates firing rate at stimulus offset (roff). *p < 0.05 (t test against 0). Gray, solid arrows indicate the peak firing rate and the time to peak rate. C, Pseudocolor plot of instantaneous firing rate at the same site for all tested values of loom speed. Green arrowhead corresponds to the loom speed in B. D, Plot of roff as a function loom speed. In green is the roff for a loom speed of 20 °/s, from (B, bottom panel). The steady-state value is shown in blue, and loom speed that evoked a response within 5% of the steady-state value is shown in red. The final dot radius at this loom speed is an estimate of the radius of the local inhibitory surround for a looming stimulus.

