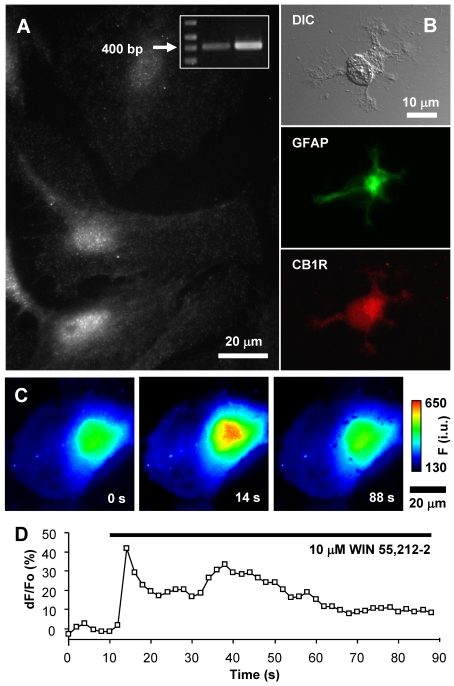
Figure 1. Expression of CB1R in visual cortex astrocytes.
(A) Localization of CB1R in cultured rat visual cortex astrocytes was identified by indirect immunocytochemistry using an antibody against CB1R. Astrocytes display puncate staining throughout the entire cell body with some accumulation in the perinuclear region. RT–PCR identified the presence of CB1R mRNA in cultured astrocytes (inset). The arrow indicates the 400 bp marker. RT–PCR primers were designed to amplify a 412 bp fragment of the full-length CB1R transcript (middle lane, astrocytes; right-hand lane, whole brain). (B) Indirect immunocytochemistry using antibodies against GFAP and CB1R on acutely isolated astrocytes from visual cortex of P1 rats. Acutely isolated astrocytes that were identified by the presence of the specific marker GFAP (green, FITC) show typical stellate morphology (DIC) and CB1R (red, TRITC) stain reminiscent of that seen in cultured astrocytes. (C) Stimulation of an astrocyte with the CB1R agonist WIN55,212-2 (10 μM) causes an increase in the internal Ca2+ elevations. The pseudocolour scale is a linear representation of the fluorescence intensities ranging from 130 to 650 intensity units (i.u.). Times (in s) indicated on images correspond to the time on the x-axis of the graph displaying a time-lapse of fluo-3 fluorescence, reporting on internal Ca2+ levels. (D) Changes in fluo-3 fluorescence are shown as dF/Fo (%) after background subtraction. The horizontal bar in the graph indicates the application of WIN55,212-2.

