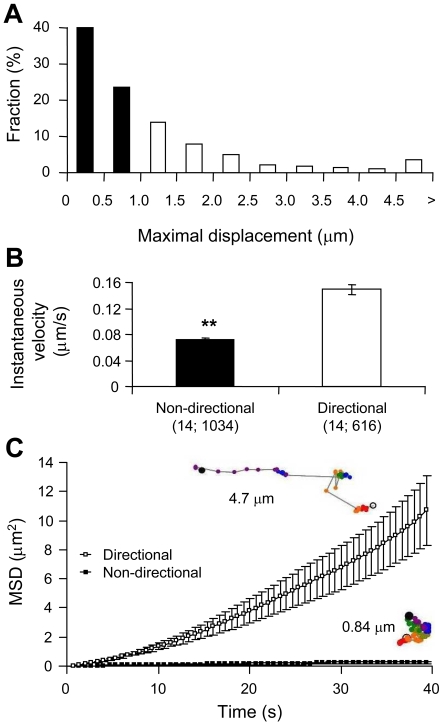
Figure 3. Mobility of CB1R–GFP puncta in astrocytes.
(A) CB1R–GFP puncta were tracked during a 60 frame time-lapse series (40 s; Movie 1) and categorized by their maximal displacement, with non-directional puncta having maximal displacement less than 1 μm (solid bars) and directional greater than 1 μm (open bars). The histogram shows the relative frequency of maximal displacement values, expressed as a percentage for all puncta (n = 1650) within the cell analysed (n = 14). (B) Non-directional CB1R–GFP puncta (solid bar) display a significantly slower instantaneous velocity compared with the directional group (open bar) (Student's t test, **P<0.01). Bars represent mean instantaneous velocity±S.E.M. Values in parentheses indicate the number of cells; total number of puncta. (C) Graph showing the average MSD±S.E.M. as a function of time for all tracked CB1R–GFP puncta within the non-directional (▪) and directional (□) categories. Examples of single puncta mobility tracks for each category are shown next to the graph traces and are colour-coded for time as described in Figure 2(C); the total track length is 4.7 μm and 0.84 μm for directional and non-directional puncta respectively.

