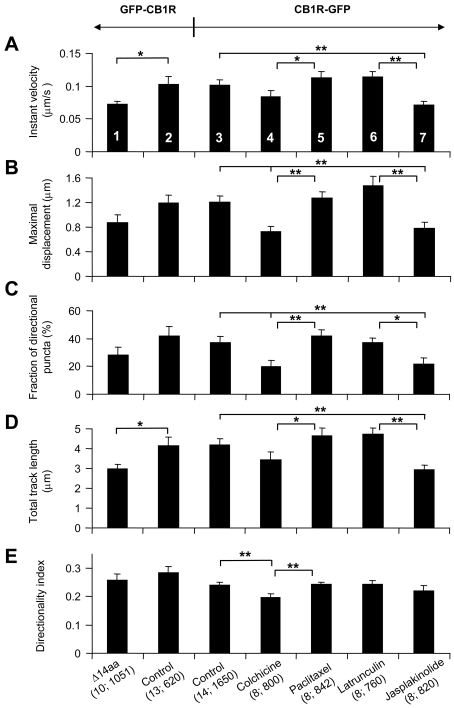
Figure 4. Distal C-terminal truncation of CB1R affects intracellular trafficking of this receptor, which utilizes microtubules and actin filaments for its traffic.
(A–E) Trafficking dynamics for cells expressing N-terminally tagged GFP–CB1R (column 2) display similar characteristics (no statistical difference) as C-terminally tagged CB1R–GFP (column 3). Truncation of GFP–CB1R at its C-terminal 14 amino acids (Δ14aa) reduces the instantaneous (Instant) velocity (A) and total track length (D) when compared with the control cells expressing the full-length GFP–CB1R (compare columns 1 and 2; Student's t test, *P<0.05). (A) Instantaneous velocity analysis of C-terminally tagged CB1R–GFP shows a decrease from control (column 3) when cells are treated with jasplakinolide (column 7). (B) Average maximal displacement was reduced significantly compared with control when cells were treated with colchicine and jasplakinolide (compare columns 3, 4 and 7). (C) The fraction of directional puncta was reduced when cells were treated with colchicine and jasplakinolide (compare columns 3, 4 and 7). (D) The average total length of tracks travelled by puncta was shorter for jasplakinolide-treated cells (compare columns 3 and 7). (E) The directionality index was reduced compared with control when cells were treated with colchicine (compare columns 3 and 4). Treatments with opposing actions on microtubules, disruption by colchicine and stabilization by paclitaxel, show a significant difference in all measured parameters (compare columns 4 and 5). Similarly, treatments with opposing actions on actin meshwork, disruption by latrunculin B and stabilization by jasplakinolide, show a significant difference in all measured parameters (A–D; compare columns 6 and 7), with the exception of the directionality index (E). The effect of pharmacological agents affecting cytoskeletal elements on C-terminally labelled CB1R–GFP trafficking was statistically tested using one-way ANOVA followed by a post-hoc Fisher's LSD test; *P<0.05 and **P<0.01 respectively. All bars, numbered by column to aid comparison, represent means±S.E.M. of individual cell averages for tracked puncta. Values in parentheses indicate number of cells; total number of puncta.

