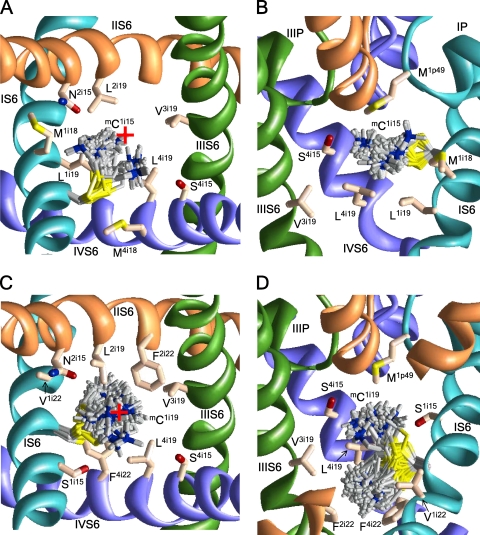
Figure 2.
The extracellular and side views of mC1i15 (A and B) and mC1i19 (C and D) in the open Cav2.1 channel. The side chains of the mC residues in different conformations within 4 kcal/mol from the apparent global minima are superimposed and shown as gray sticks with blue nitrogen and yellow sulfur atoms. Native residues are shown in the lowest energy conformation as pale orange sticks with red oxygens, blue nitrogens, and yellow sulfur atoms. The P loops and S6s in repeats I, II, III, and IV are cyan, orange, green, and violet, respectively. For clarity, P loops in A and C, IIS6 in B, and S5s in A–D are not shown. The ammonium group of mC1i15 is inside the pore (A) between levels i15 and i18 (B). The ammonium group of mC1i19 is close to the pore axis (C) approaching either the focus of P helices or level i22 (D). The red cross at A and C indicates the pore axis.

