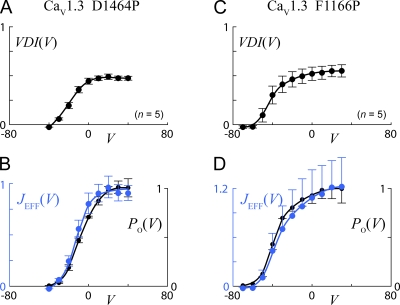
Figure 2.
JEFF analysis applied to two CaV1.3 constructs with enhanced VDI (see our companion paper, Tadross et al., 2010), D1464P (left panels) and F116P (right panels). (A and C) VDI300 parameters (see Fig. 2, A and B, of our companion paper [Tadross et al., 2010] for definition) plotted as a function of voltage (mV). Error bars show SEM. Number of cells (n) as indicated. (B and D) Close similarity of JEFF (blue) and normalized PO(V) (black), arguing for predominance of voltage inactivation from the open state. JEFF is calculated from data in A and C according to Eq. 9, and PO is the normalized open probability from our companion paper (Tadross et al., 2010), both plotted as a function of voltage (mV). Error bars represent the SEM, as estimated by transforming the mean ± SEM from A and C via Eq. 9.

