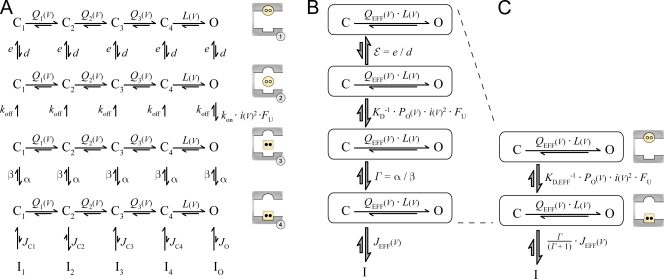
Figure 3.
Multistate gating diagram for CDI analysis. (A) Generalized multistate diagram describing CaM-mediated CDI. Horizontal transitions refer to standard channel activation, identical to that in Fig. 1 A. Vertical transitions relate to various steps in the progression to CDI. The top four rows correspond to different CaM/channel configurations, and the physical significance of each configuration is cartooned to the right of each row. In row 1, apoCaM (yellow circle) is bound to the apoCaM site (round pocket). In row 2, apoCaM has transiently dissociated from the channel. In row 3, CaM has bound two Ca2+ ions (black dots) to become Ca2+/CaM (yellow square), which then binds the Ca2+/CaM effector site (square pocket) in row 4. Channels in row 4 are primed for inactivation and can become inactivated according to state-dependent equilibrium constants, analogous to those in Fig. 1 A. (B and C) Simplified but equivalent state diagrams, assuming the slow CaM regimen. In B, KD = koff/kon is the Ca2+ dissociation constant of a transiently dissociated CaM (see cartoon of rows 2 and 3). In C, KD,EFF = KD · (ε + 1)/(Γ + 1) is the effective Ca2+ dissociation constant of the entire CaM/channel complex.

