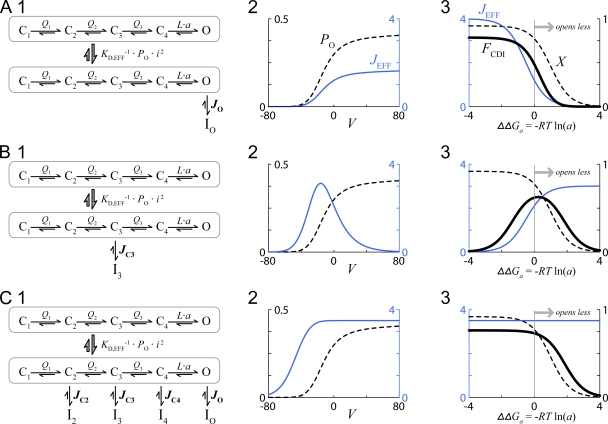
Figure 4.
Tests for preferred states leading to CDI. (A) Behavior of the model in Fig. 3 if inactivation were to proceed exclusively from the open conformation. (A, 1 and 2) Analogous to Fig. 1 D. (A, 3) FCDI and its underlying components JEFF and X (Eq. 17), all at fixed voltage V = 0 with varying ΔΔGa, where ΔΔGa = −R · T · ln(a) and R · T = 0.6 kCal/mole. The majority of parameters, including Q1(V), Q2(V), Q3(V), L(V), JC1, JC2, JC3, JC4, and JO, are all identical to those in Fig. 1 D. Beyond this, G = 0.75, Keff = 0.028, and i(V = 0)2/i(VU)2 = 1.27. (B) Behavior of the model in Fig. 3 if inactivation were to proceed exclusively from state C3. Format and parameters identical to A, except JC1 = JC2 = JC4 = JO = 0 and JC3 = 12. (C) Behavior of the model in Fig. 3 if inactivation were to proceed equally from states C2, C3, C4, and O. Format and parameters as in A, except JC1 = 0 and JC2 = JC3 = JC4 = JO = 3.5.

