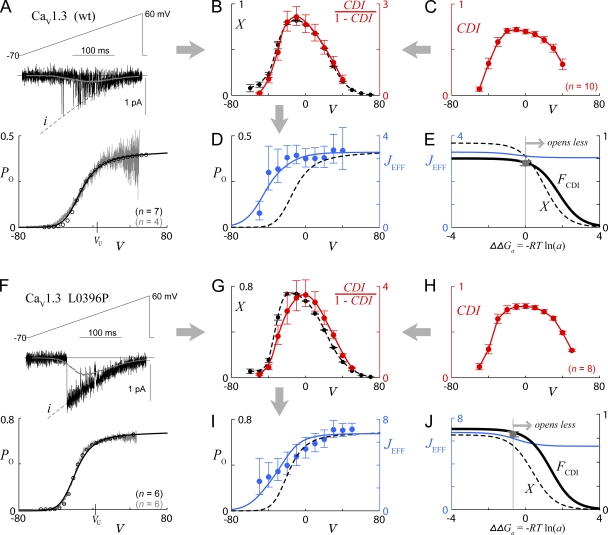
Figure 5.
Actual tests for preferential closed state CDI. (A) Single-channel and tail-activation analysis of wild-type CaV1.3, reproduced from prior work (Tadross et al., 2008), after shifting along the voltage axis to account for different external solution used in the whole cell experiments of our companion paper (Tadross et al., 2010). Voltage is in units of mV throughout. (Top) Exemplar single-channel activity during voltage ramp protocol. Dashed black curve indicates the unitary current, i(V). U-shaped gray curve (overlying exemplar trace) shows ensemble average current over many sweeps. Single-channel PO(V) curve (bottom) deduced by dividing ensemble average current into i(V) relations. Circles represent whole cell tail activation data from prior work (Tadross et al., 2008). Number of cells (tail activation) and patches (single channel) are indicated in black and gray, respectively. Solid black curve overlying PO(V) corresponds to the model fit described below. See Tadross et al. (2008) for detailed experimental conditions and analysis methodology. (B) Components required for calculation of JEFF. X(V) (black) is deduced from Eq. 16, based upon PO(V) and i(V) data in A, together with further voltage block parameters (Tadross et al., 2008) as follows: G = 0.75, Keff = 0.028, and i(V = 0)2/i(VU)2 = 1.27. CDI/(1 − CDI) in red is determined from data in C. (C) Population data for extent of CDI (CDI50 parameter from our companion paper, Tadross et al., 2010), plotted as a function of voltage. Error bars show SEM. Number of cells (n) as indicated. (D) JEFF(V) (blue symbols) calculated from the ratio of components in B, according to Eq. 16. Error bars represent the SEM, as estimated by transforming the mean ± SEM from experimental data via Eq. 16. Dashed black curve (replicated from PO curve in A) and solid blue curve are based upon fits of the model in Fig. 4 C (1) to PO(V) and JEFF(V) data points. Parameters identical to Fig. 4 C, except JC2 = JC3 = 2.55 and JC4 = JO = 3.28. (E) Predicted ΔΔGa dependence of JEFF, X, and FCDI for the model fits described above, all at V = 0. Gray data point at ΔΔGa = 0 corresponds to CDI data point (at V = 0) from C, which closely approximates FCDI. (F–J) Identical analysis as in A–E, here performed for the CaV1.3 L0396P mutant. Voltage block parameters for this channel are: G = 0.83, Keff = 0.051, and i(V = 0)2/i(VU)2 = 1.05 (Tadross et al., 2008). Parameters for model fits in I and J are identical to those for the wild-type channel, except that L(V) is multiplied by a factor of 3.1 (corresponding to ΔΔGa = −0.68 kcal/mole), and JC2 = JC3 = 3.09 and JC4 = JO = 6.75. Model fits in J, as well as gray data point (corresponding to V = 0 data point from H), are shifted by −0.68 kcal/mole to reflect the enhanced opening of the CaV1.3 L0396P mutant.

