Figure 4.
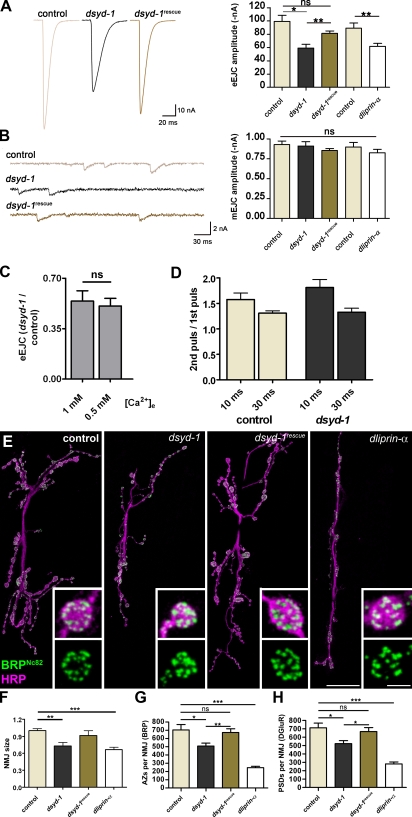
Comparative analysis of NMJ morphology and function in dsyd-1 and dliprin-α mutant animals. (A) Mean traces (left) of eEJCs at 0.2-Hz nerve stimulation recorded from the larval NMJ at 1 mM extracellular calcium (muscle 6) for controls, dsyd-1, and dsyd-1rescue; and mean eEJC amplitudes (right) for dsyd-1 and control group (control: 99.3 ± 9.6 nA; dsyd-1: 59.2 ± 5.9 nA; both: n = 9, P = 0.01), dsyd-1rescue (dsyd-1: 81.4 ± 4.5 nA, n = 9, P = 0.003; control: P = 0.162) as well as for dliprin-α and the control group (control: −89.4 ± 7.7 nA; dliprin-α: −62.0 ± 4.3 nA; both: n = 7, P = 0.007). Both dliprin-α and dsyd-1 show reduced amplitudes compared with controls. This defect is significantly rescued by reexpressing dsyd-1 cDNA in dsyd-1–deficient animals using a motoneuron-specific driver (ok6-GAL4). (B) Sample traces of mEJCs (right) for control, dsyd-1, and dsyd-1rescue animals. Mean mEJC amplitudes (left) for controls (0.93 ± 0.05 nA, n = 7), dsyd-1 (0.91 ± 0.05 nA, n = 8), and dsyd-1rescue (0.86 ± 0.02 nA, n = 9), as well as dliprin-α (0.83 ± 0.05 nA, n = 7) and control (0.90 ± 0.06 nA, n = 7), are comparable (dsyd-1 × control: P = 0.86; dsyd-1 × dsyd-1rescue: P = 0.54; control × dsyd-1rescue: P = 0.14; control × dliprin-α: P = 0.46). (C) dsyd-1 eEJC amplitudes normalized against mean control eEJC amplitude recorded at 1 mM (0.54 ± 0.07, n = 11) or 0.5 mM (0.51 ± 0.05, n = 8; P = 0.48) extracellular calcium, respectively. (D) Paired pulse experiments with a 10-ms (control: 1.58 ± 0.13, n = 11; dsyd-1: 1.81 ± 0.16, n = 13; P = 0.25) or 30-ms (control: 1.31 ± 0.05, n = 12; dsyd-1: 1.33 ± 0.08, n = 12; P = 0.98) interpulse interval recorded at 0.5 mM extracellular calcium. (E) Projection of confocal stacks of muscles 6 and 7 NMJs, labeled with antibodies recognizing BRP (BRPNc82, green) and HRP (magenta). Bars, 10 µm and 1 µm (insets). (F) Morphological size of dliprin-α and dsyd-1 mutant NMJs was reduced compared with controls. The latter was rescued by motoneuron-specific reexpression of dsyd-1cDNA (control: 1.0 ± 0.04, n = 30; dsyd-1: 0.73 ± 0.06, n = 14; dsyd-1rescue: 0.91 ± 0.08, n = 8; dliprin-α: 0.66 ± 0.04, n = 14; control × dsyd-1: P < 0.01; control × dsyd-1rescue: P > 0.05; control × dliprin-α: P < 0.001; dsyd-1 × dsyd-1rescue: P > 0.05; dsyd-1 × dliprin-α: P > 0.05; dsyd-1rescue × dliprin-α: P > 0.05, one-way analysis of variance [ANOVA]). (G) Number of AZs per NMJ counted via α-BRPNc82 labeling. In both dsyd-1 and dliprin-α mutants, AZ numbers were reduced compared with controls. The reduction seen in dsyd-1 mutants was rescued by presynaptic dsyd-1 cDNA expression (control: 704.6 ± 64.94, n = 14; dsyd-1: 508.6 ± 36.07, n = 14; dsyd-1rescue: 673.1 ± 45.30, n = 10; dliprin-α: 247.3 ± 15.81, n = 8; control × dsyd-1: P = 0.020; control × dsyd-1rescue: P = 0.75; control × dliprin-α: P = 0.0002; dsyd-1 × dsyd-1rescue: P = 0.008). (H) Number of PSDs defined by DGluRIID (not depicted). The results were comparable to those in G (control: 712.7 ± 55.24, n = 20; dsyd-1: 523.5 ± 36.35, n = 13; dsyd-1rescue: 667.9 ± 46.85, n = 8; dliprin-α: 281.1 ± 22.83, n = 7; control × dsyd-1: P = 0.025; control × C: P = 0.86; control × dliprin-α: P = 0.0002; dsyd-1 × dsyd-1rescue: P = 0.047). Statistics: Mann-Whitney test. Error bars indicate the SEM. *, P < 0.05; **, P < 0.01; ***, P < 0.005; ns, P > 0.05.

