Figure 5.
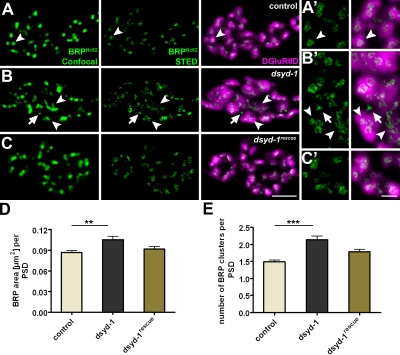
Abnormal BRP clusters in dsyd-1. (A–C) BRP puncta (confocal, left), BRP-donuts (STED, middle), and DGluRIID with BRP donuts (right). (A) The control BRP donut is indicated by arrowheads. (B) AZ size (arrowheads) is affected in dsyd-1. BRP donuts lacking postsynaptic DGluRIID receptors are observed as well (arrows). BRP donuts are frequently interconnected and abnormally shaped (arrowheads). (C) Defects are largely rescued by reexpression of UAS–dsyd-1cDNA. Bar, 1 µm. (A’–C’) Magnified views of A–C. Bar, 250 nm. (D) Quantification shows elevated areas of individual BRPNc82 clusters (control: 0.087 ± 0.002 µm2, n = 298; dsyd-1: 0.105 ± 0.005 µm2, n = 265; dsyd-1rescue: 0.091 ± 0.004 µm2, n = 207; control × dsyd-1: P < 0.01; control × dsyd-1rescue: P > 0.05; dsyd-1 × dsyd-1rescue: P > 0.05). (E) Number of individual BRP clusters per single PSDs (control: 1.49 ± 0.05, n = 297; dsyd-1: 2.14 ± 0.12, n = 265; dsyd-1rescue: 1.79 ± 0.08, n = 207; control × dsyd-1: P < 0.001; control × dsyd-1rescue: P > 0.05; dsyd-1 × dsyd-1rescue: P > 0.05). Statistics: one-way ANOVA. Error bars indicate the SEM. **, P < 0.01; ***, P < 0.005.

