Figure 7.
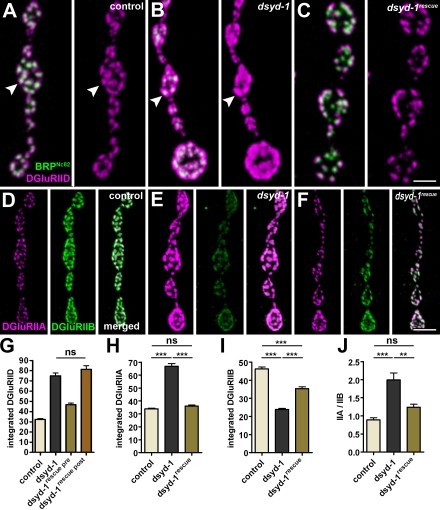
DSyd-1 controls postsynaptic GluR field size and composition. (A–C) Co-labeling of DGluRIID and BRPNc82 for control (A), dsyd-1 mutant (B), and presynaptically rescued (C) NMJs. Individual PSDs are indicated by arrowheads. (D–F) Co-labeling of DGluRIIA and DGluRIIB for control (D), dsyd-1 mutant (E), and presynaptically rescued (F) NMJs. (G) Integrated DGluRIID signal (control: 32.25 ± 0.67 au, n = 1,314; dsyd-1: 74.86 ± 2.98 au, n = 335; dsyd-1rescue pre: 46.71 ± 1.60 au, n = 515; dsyd-1rescue post: 81.25 ± 3.54 au, n = 344; control × dsyd-1: P < 0.001; control × dsyd-1rescue pre: P < 0.001; control × dsyd-1rescue post: P < 0.001; dsyd-1 × dsyd-1rescue pre: P < 0.001; dsyd-1 × dsyd-1rescue post: P > 0.05; dsyd-1rescue pre × dsyd-1rescue post: P < 0.001). (H) Integrated DGluRIIA signal (control: 33.88 ± 0.66 au, n = 1,064; dsyd-1: 66.85 ± 2.09 au, n = 667; dsyd-1rescue: 36.31 ± 0.87 au, n = 830; control × dsyd-1: P < 0.001; control × dsyd-1rescue: P > 0.05; dsyd-1 × dsyd-1rescue: P < 0.001). (I) Integrated DGluRIIB signal (E, control: 46.40 ± 0.99 au, n = 934; dsyd-1: 23.85 ± 0.60 au, n = 783; dsyd-1rescue: 35.46 ± 0.89 au, n = 770; control × dsyd-1: P < 0.001; control × dsyd-1rescue: P < 0.001; dsyd-1 × dsyd-1rescue: P < 0.001) size in dsyd-1 mutants. (J) GluR field composition (control: 0.89 ± 0.06, n = 7; dsyd-1: 1.99 ± 0.19, n = 8; dsyd-1rescue: 1.24 ± 0.08, n = 6; control × dsyd-1: P < 0.001; control × dsyd-1rescue: P > 0.05; dsyd-1 × dsyd-1rescue: P < 0.01). Statistics: one-way ANOVA. Error bars indicate the SEM. **, P < 0.01; ***, P < 0.005; ns, P > 0.05. Bars: (A–C) 1 µm; (D–F) 2 µm.

