Figure 8.
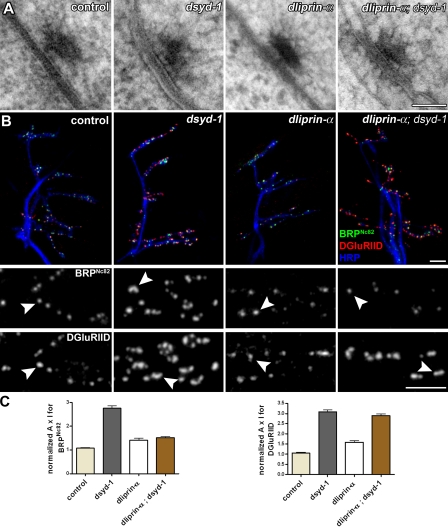
Embryonic dsyd-1 phenotypes. (A) High-pressure freeze/freeze substitution–prepared NMJ synapse of control, dsyd-1, dliprin-α, and dliprin-α; dsyd-1 double mutant embryos. All genotypes still form electron-dense projections (T bars) at the AZ. (B) Immunostaining of a region comprising muscles 6/7, 12/13, and 4 in late embryos of control, dsyd-1, dliprin-α, and dliprin-α; dsyd-1. Staining: HRP, BRP, and DGluRIID. (B, middle and bottom) Magnifications showing single synapses, with arrowheads denoting BRP (middle) and DGluRIID (bottom) puncta in the indicated mutants. (C) Quantification of BRP and DGluRIID signals at embryonic synapses. BRP signal in dsyd-1 single mutants is significantly increased compared with control, dliprin-α, and dliprin-α; dsyd-1 double mutants. DGluRIID is increased to a similar extent in dsyd-1 and dliprin-α; dsyd-1 double mutants compared with control and dliprin-α mutant animals. Statistics for BRP were as follows. Control: 1.07 ± 0.027, n = 735; dsyd-1: 2.75 ± 0.11, n = 457; dliprin-α: 1.41 ± 0.079, n = 183; dliprin-α; dsyd-1: 1.51 ± 0.054, n = 446; control × dsyd-1: P < 0.001; control × dliprin-α: P < 0.05; control × dliprin-α; dsyd-1: P < 0.001; dsyd-1 × dliprin-α: P < 0.001; dsyd-1 × dliprin-α; dsyd-1: P < 0.001; dliprin-α × dliprin-α; dsyd-1: P > 0.05. Statistics for DGluRIID were as follows. Control: 1.06 ± 0.029, n = 765; dsyd-1: 3.08 ± 0.10, n = 541; dliprin-α: 1.59 ± 0.080, n = 218; dliprin-α; dsyd-1: 2.90 ± 0.088, n = 612; control × dsyd-1: P < 0.001; control × dliprin-α: P < 0.001; control × dliprin-α; dsyd-1: P < 0.001; dsyd-1 × dliprin-α: P < 0.001; dsyd-1 × dliprin-α; dsyd-1: P > 0.05; dliprin-α × dliprin-α, dsyd-1: P < 0.001. Statistics: one-way ANOVA. Error bars indicate the SEM. Bars: (A) 70 nm; (B, top) 2 µm; (B, middle and bottom) 1 µm.

