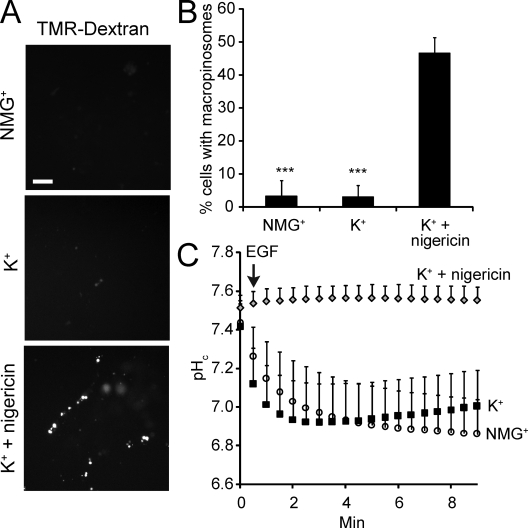
Figure 3.
Effect of Na+ omission on macropinocytosis and pHc. (A) Epifluorescence images of islands of A431 cells after 10 min incubation with TMR-dextran and EGF in the indicated Na+-free media. To clamp pHc (bottom panel), cells were preincubated in K+/nigericin. Bar = 10 µm. (B) Quantification of macropinocytosis in Na+-free solutions. Data are means ± SE of 3–4 experiments. Data were compared with controls in Na+-rich medium (as in Fig. 1 B) and significance calculated using Student’s t test; ***, P < 0.001. (C) Measurement of pHc using SNARF-5F in cells treated with EGF in the indicated buffers. Data are means ± SE of three experiments, each measuring 10 cells.

