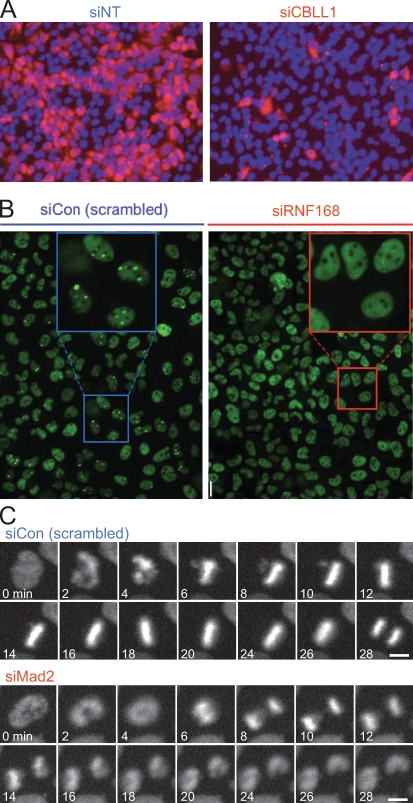
Figure 1.
Examples for imaging-based assays. (A) Intensity-based assay. In this screen for human genes associated with West Nile virus infection, cell nuclei were labeled with DAPI (blue) and stained by immunofluorescence against a viral epitope (red). Genes that reduced the intensity of viral epitope staining were scored as hits. (left) Negative control (NT-siRNA). (right) Hit (CBLL1-siRNA) identified in the screen. This panel is reprinted with permission from Nature Publishing Group (Krishnan et al., 2008). (B) Morphology-based assay for genes functioning in the assembly of DNA double-strand repair foci. Cells were stained by immunofluorescence for 53BP1, a protein which localizes to spontaneously occurring DNA damage foci, visible as bright green spots (see negative control; left). In a hit obtained in this screen (siRNF168), 53BP1 failed to target to spots and was instead dispersed throughout the nucleoplasm. This panel is reprinted with permission from Elsevier (Doil et al., 2009). (C) Live imaging-based assay for mitotic timing. HeLa cells stably expressing chromatin marker H2B-mCherry (Steigemann et al., 2009) were imaged for 24 h on an incubated screening microscope (Schmitz and Gerlich, 2009). Mitotic phenotypes were detected based on the timing from nuclear breakdown (2 min in siCon) until anaphase (28 min in siCon). Cells depleted for the spindle checkpoint protein Mad2 prematurely enter anaphase (8 min). Images provided by D.W. Gerlich. Bars, 10 µm.

