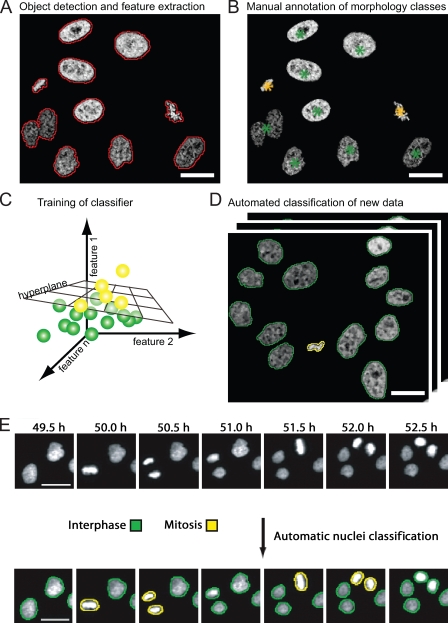
Figure 3.
Supervised machine learning for classification of cellular morphologies. (A) Detection of cells based on fluorescent chromatin label (core histone 2B fused to GFP; Kanda et al., 1998), as indicated by red contours. A set of quantitative texture and shape features is then extracted for each segmented object. (B) Manual annotation of morphology classes. In this example, interphase cell nuclei are annotated by green asterisks, and metaphase chromosome plates are annotated by yellow asterisks. (C) The hyperplane that optimally separates the two different morphology classes is automatically determined by the classification algorithm. The hyperplane can be defined by linear functions (as shown) or by radial base functions, depending on the classification algorithm. (D) The trained classifier can be applied to new data for automated classification of trained morphology classes. The yellow and green contours label interphase and metaphase morphology classes as shown in B. (E) Time-resolved assay for mitotic progression. Live HeLa cells expressing fluorescent core histone 2B (H2B-GFP) were imaged by automated time-lapse microscopy for 24 h using a 10× dry objective. Morphological classes were annotated by machine learning and pattern classification. This panel is reprinted with permission from Nature Publishing Group (Neumann et al., 2006). Bars, 20 µm.

