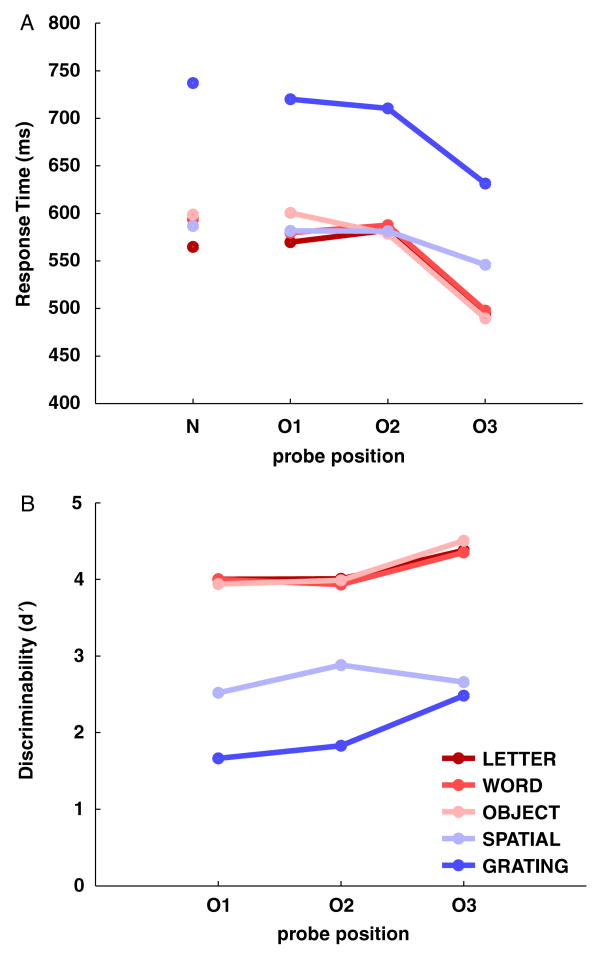
Figure 3.
The effect of stimulus type and probe type on behavior. a: The mean discrimination score is plotted for each of the three serial positions (O1, O2, O3) and each of the five stimulus types (letter, word, object, spatial, and grating). b: The mean response time for correct trials is plotted for each of the four probe types (N, O1, O2, O3) and each of the five stimulus types.

