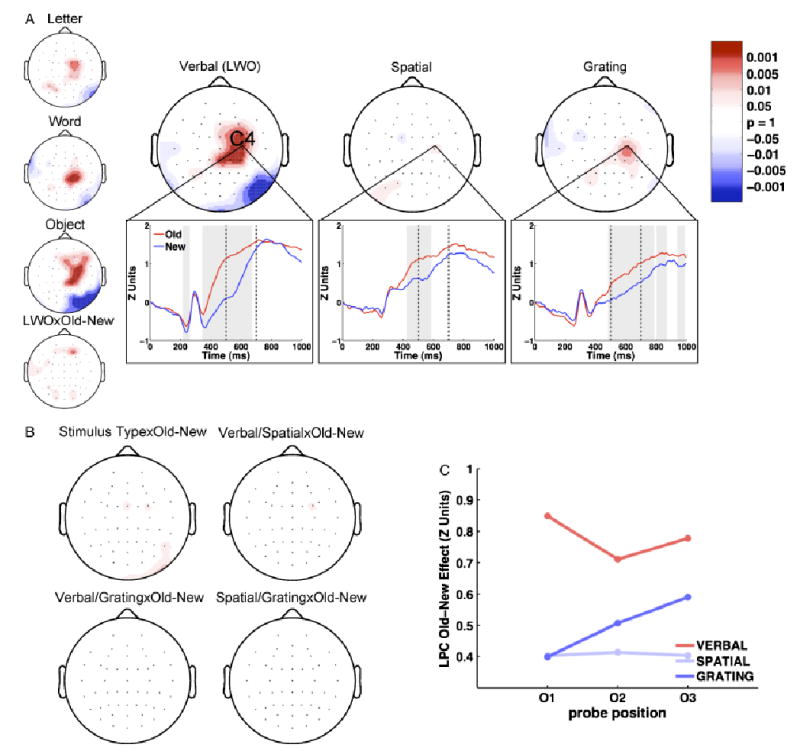
Figure 5.

The ERP Old–New (O/N) effect: LPC (500–700 ms). a: Large topoplots display the LPC Old–New effect for verbal, spatial, and grating stimuli (red: O>N; blue: N>O). Small topoplots display the effects for the letter, word, and object stimuli, which are averaged to obtain the verbal plot, as well as the interaction between verbal stimulus type (LWO) and Old–New. The bottom plots are representative waveforms drawn from electrode C4 for O (red) and N (blue) probes. Dashed vertical lines represent the time period analyzed in the topographic plots. Gray shading indicates periods of significant Old–New effects. b: The topography of the interaction between stimulus type and Old–New, along with topography of the pairwise comparisons across stimulus types. c: The mean amplitude of the LPC Old–New effect is plotted for each stimulus type and serial position at electrode C4.
