
Figure 2. Optimization and analysis of on-chip stimulation.
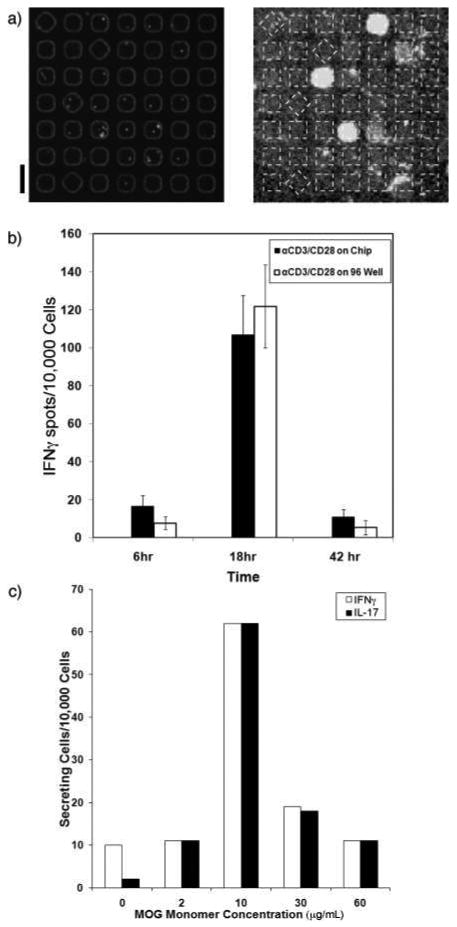
a) Fluorescent micrographs of a block of microwells containing PBMCs (labeled with Hoescht dye) and the matched region of the printed microarray of captured IFNγ. The array of microwells was coated with streptavidin (200 μg/mL), followed by biotinylated anti-CD3 (10 μg/mL) and anti-CD28 (1 μg/mL). The cells were incubated on the modified wells for 6 h at 37 °C prior to microengraving. The boxes (dashed lines) on the right hand image have been overlaid to clarify the regions of interest. The scale bar is 100 μm. b) A plot of the measured frequencies of IFNγ-secreting PBMCs after stimulation either directly on-chip for 6, 18, or 42 h (black) or in bulk in a 96-well microtiter plate (white) for 6, 18, or 42 h. After bulk stimulation, the cells were deposited into microwells for microengraving. The error bars represent the range in responses measured in three independent experiments. c) A plot of the frequencies of IFNγ-secreting (white) and IL-17-secreting (black) MOG-specific clones following on-chip stimulation for 6 h as a function of applied concentration of MOGp97-109-loaded HLA DRB1*0401 monomer (0, 2, 10, 30, 60 μg/mL).