
Figure 3. Specific activation of T cell clones on-chip.
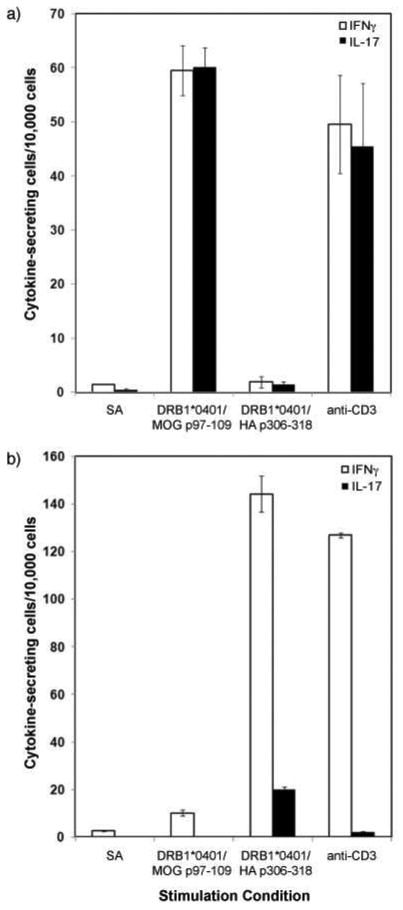
Plots of the frequencies of IFNγ-secreting (white) and IL-17 secreting (black) (a) MOG-specific and (b) HA-specific T cell clones following on-chip stimulation for 6 h. The stimulation conditions included streptavidin only (SA), MOGp97-109-loaded HLA DRB1*0401 monomer (10 μg/mL), HAp306-318-loaded HLA DRB1*0401 monomer (10 μg/mL), and anti-CD3 (OKT3; 10 μg/mL). All conditions, except streptavidin only, also included anti-CD28 (1 μg/mL) for co-stimulation. Both IFNγ (white bars) and IL-17 (black bars) were captured by microengraving after stimulation. The error bars indicate the range in frequencies measured from three independent experiments.