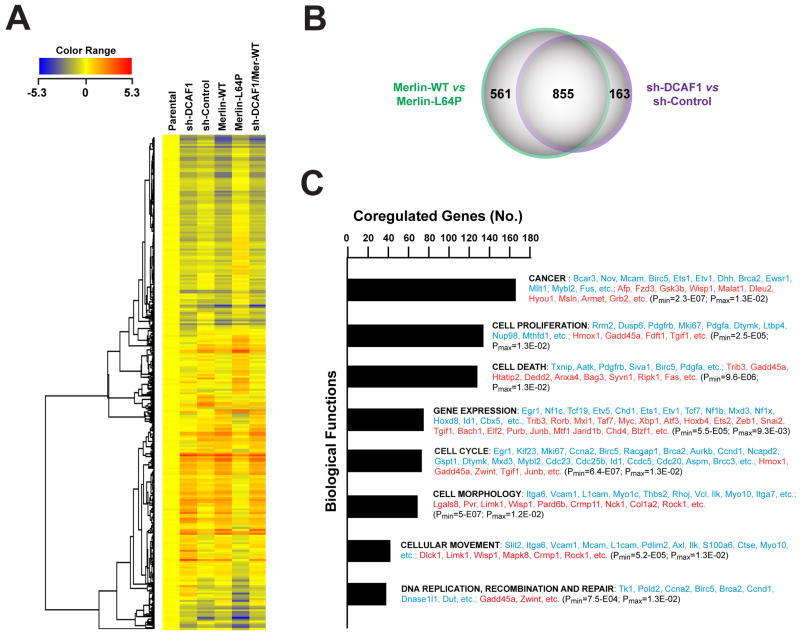
Figure 4. Expression of Merlin and Depletion of DCAF1 Induce a Largely Overlapping Gene Expression Program.
(A) FC-1801 cells were infected with lentiviral vectors encoding a sh-RNA targeting DCAF1 (sh-DCAF1), a control sh-RNA (sh-Control), wild type Merlin, Merlin-L64P, or sh-DCAF1 in combination with wild type Merlin and subjected to DNA microarray analysis. Unsupervised clustering of 1,566 probesets differentially expressed ≥ 2 fold in at least one of the two major comparisons (sh-DCAF1 versus sh-Control and Merlin-WT versus Merlin-L64P). Values normalized to parental uninfected cells.
(B) Venn Diagram shows the overlap between the list of genes differentially expressed upon expression of Merlin-WT or silencing of DCAF1 (fold change ≥ 2). Coregulated genes (885) are identified as differentially expressed ≥2 fold in one of the two comparisons and displaying a consensual significant change in the other comparison (p ≤ 0.01 by the ANOVA test).
(C). 667 genes coregulated upon expression of Merlin-WT or silencing of DCAF1 (fold change ≥ 2 in both comparisons) was subjected to Ingenuity Pathway analysis. Both down-regulated (353) and upregulated genes (314) are included in the category of Biological Functions. Representative downregulated genes are shown in blue and representative upregulated genes in red in order of decreasing average fold change.
See also Supplemental Figure S4.

