Figure 2.
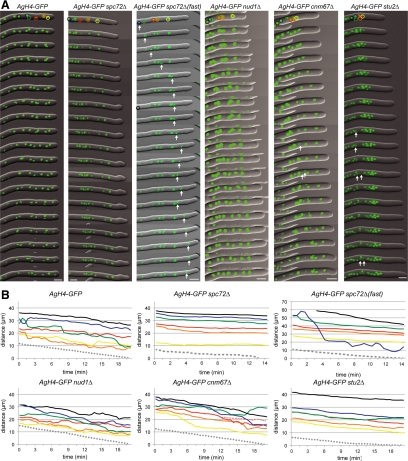
Time-lapse analysis of nuclear migration in different mutants. (A) Overlays of DIC and AgH4-GFP signals from time-lapse video imaging of wild-type (Supplemental Movie S1), Agspc72Δ (Supplemental Movie S2), Agnud1Δ (Supplemental Movie S4), Agcnm67Δ (Supplemental Movie S5), and Agstu2Δ (Supplemental Movie S6) hyphae. Images were captured every 30 s, and 1-min interval frames are shown. Migration of the first six nuclei were tracked and are shown in the schematic. In Agspc72Δ(fast) (Supplemental Movie S3), images from each 30-s time point are shown for the first 7 min followed by 1-min interval frames; the rapidly moving nucleus is indicated by an arrow. Nuclei undergoing mitosis are indicated by arrows in Agcnm67Δ and Agstu2Δ. Bars, 5 μm. (B) Positions of the first six nuclei in each hyphae and the hyphal tip (gray dotted line) were tracked throughout each time course and are plotted. In wild-type, the nuclei were observed to undergo bypassing and oscillations. In Agspc72Δ(fast), one nucleus (blue) moves rapidly toward the tip, thereby bypassing four other nuclei in <5 min and traveling distances up to 8.9 μm within a 30-s interval (1.5–2 min). The other nuclei in this hypha as well as in the other Agspc72Δ and Agstu2Δ mutants move toward the tip with the cytoplasmic stream without undergoing any bypassing or oscillation.

