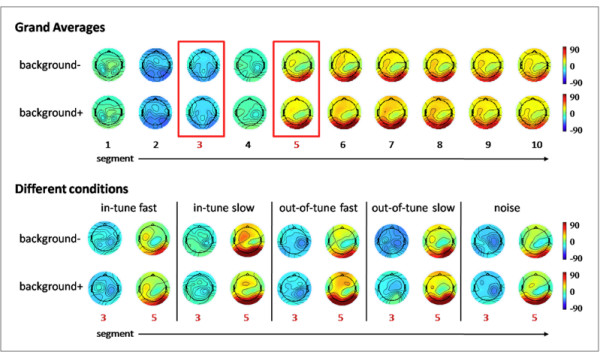
Figure 4.

Mean ERDs and ERSs (in %) as topoplots broken down for the 10 time segments and for learning with (background+) and without (background-) musical background music. Blue indicates ERD and red ERS. The time segments are printed under the topoplots (upper panel). In the lower panel the topoplots are shown broken down for the two most interesting time segments (3 and 5) and the different musical background conditions.
