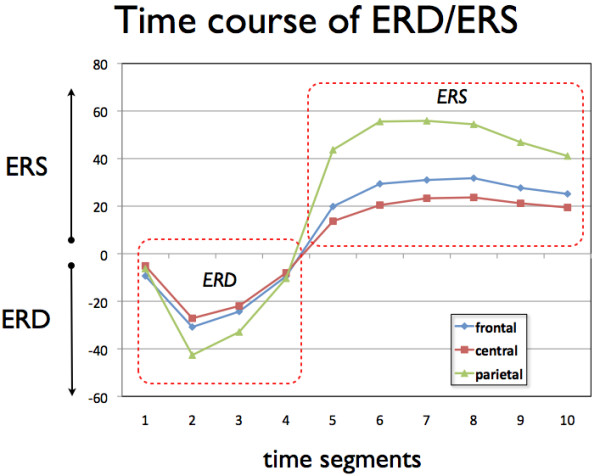
Figure 5.

Time courses of the changes in alpha-band power after word presentation broken down for the three brain regions of interest. Each time segment represents the mean ERD/ERS over a 400 ms segment (averaged across the different groups and the 2 background conditions). Indicated are the 10 time segments after word presentation. Negative values indicate a decrease in alpha-band power (event related desynchronization: ERD) while positive values indicate an increase of alpha-band power (event related synchronization: ERS) during learning compared to the baseline condition.
