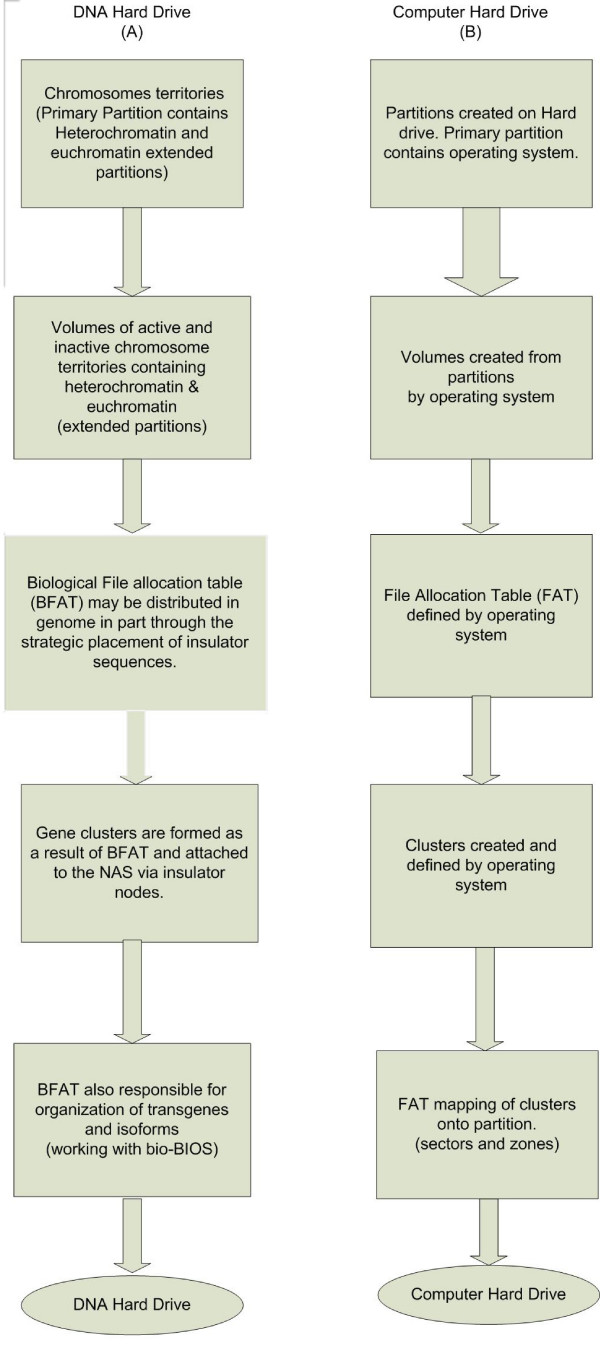
Figure 5.
Flow chart comparison of high level formatting of DNA and CHD. Formatting models of both the DNA Hard Drive and the Computer Hard Drive. Figure A shows the path for high level formatting of the DNA molecule. Starting with the physical organization of the chromosomes into specific territories which then results in high level formatting layered on the DNA molecule itself and finally implemented onto the sub-nuclear lamin in the form of rosette patterns of gene clusters. Figure B consists of the computer hard drive illustrating high level formatting processes. Notice the similarities between the two models which show a degree of functional equivalence.

