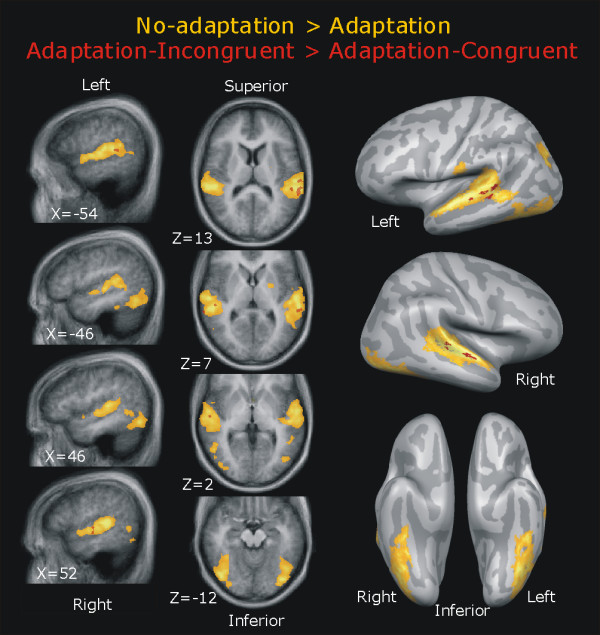
Figure 4.

Overview of general and specific adaptation effects. Left panel: random-effects group maps (n = 16) of the No-adaptation vs. Adaptation (yellow) and Adaptation-Incongruent vs. Adaptation-Congruent (red) contrasts (cluster-level corrected at p < 0.05), projected on transversal and sagittal slices of the averaged anatomical image. Right panel: cortex-based aligned random-effects group maps (at the same threshold) on the inflated averaged cortical meshes of both hemispheres.
