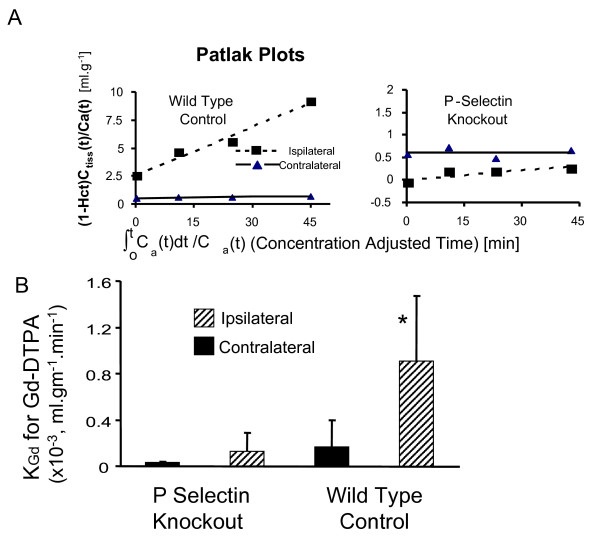
Figure 2.
Effect of transient focal cerebral ischemia on the transfer constant (KGd) for Gd-DTPA into brain. Shown in the upper panel (A) are the Patlak Plots used to determine KGd. The y-axis in these plots is the ratio of the tissue concentration of contrast Ctiss(t), divided by the arterial plasma concentration at that time, i.e. Ca(t)/(1-Hct), where Hct is the arterial hematocrit. The tissue concentration was determined from measures of tissue T1 and the blood concentration was estimated from T1 in the sagittal sinus. The slope provides a measure of KGd. The lower Panel (B) shows that mean KGd values for Gd-DTPA are less in P-selectin knockout animals compared to Wildtype controls. * P < 0.03, P-selectin Knockouts compared to Wild type groups, ipsilaterally.

