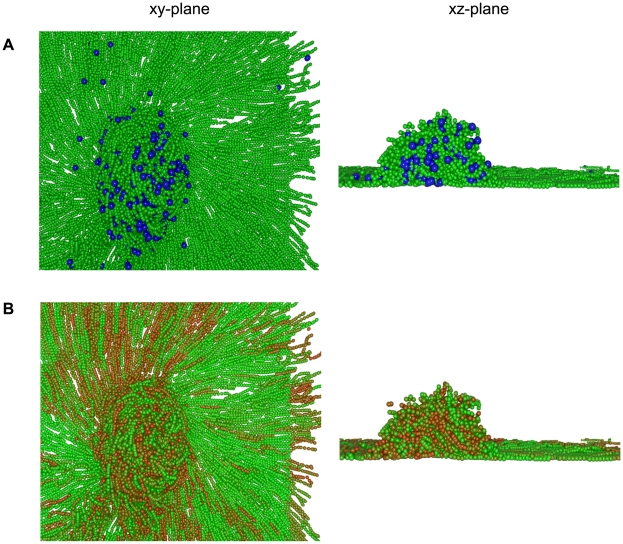
Figure 7. The localisation of C-signal and myxospores within a fruiting body.
Simulation is shown after 24 h. (A) View of the simulation showing motile cells (green) and myxospores (blue spheres). (B) View of the simulation showing the accumulated C-signal in each cell. C-signal is a dimensionless quantity measured between zero (green) and 400 units (red).

