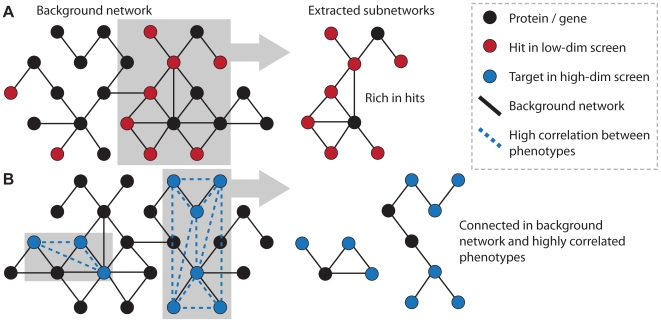
Figure 3. Extracting rich subnetworks.
Different patterns in the graph point to a common cellular mechanism causing a phenotype: (A) hits in a low-dimensional screen (red nodes) clustering in highly connected subnetworks, and (B) high correlation between high-dimensional phenotypes of target genes connected in the background network. The black graph represents any type of background network.

