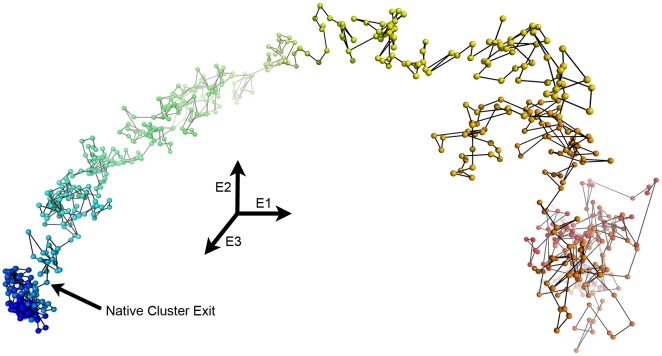
Figure 4. Conformational clustering effectively defines the exit from the native state.
3-D representation of conformational clustering of 500K1 generated by multi-dimensional scaling of the all-versus-all Cα RMSD. Each sphere is a conformation from every 10 ps of 500K1 and is connected by sticks to the preceding and following conformation. The earliest conformations are colored blue and the latest, red. E1, E2, and E3 represent the first through third eigenvectors from the multi-dimensional scaling. The exit from the native cluster is identified by the arrow and is at 1.41 ns.

