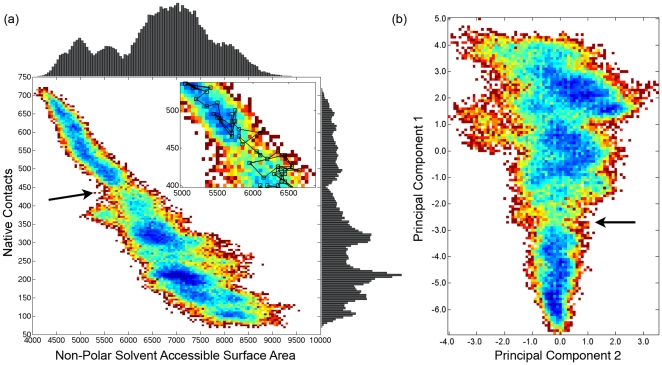
Figure 5. Property-based landscapes clearly separate native from non-native conformations.
(a) The unfolding landscape is generated from all five unfolding simulations using native contacts and NPSASA as order parameters. 1-D histograms of native contacts and NPSASA are found to the right and above the landscape, respectively. The landscape was generated by taking the negative natural logarithm of the 2-D histogram with white being unobserved in the simulations, dark red the least populated, and progressing to dark blue as the most populated. The native state is in the upper left corner. A less populated region (indicated by the arrow) centered around 450 native contacts and 5900 Å2 separates native-like conformations from non-native conformations and represents the TSE. (inset) Zoomed-in view of TSE region, with trace of 500K1 overlaid. 500K1 crosses the TSE barrier only once and in less than 10 ps, between 1.41 and 1.42 ns; other simulations exhibit similar behavior. (b) Principal components analysis was used to reduced ten conformational properties to two dimensions (see Methods for list of properties). Coloring is the same as in (a). The native state is the well-populated region at the bottom of the figure and is separated from the non-native state by a barrier near −2.7 in PC1 (indicated by the arrow). Note that significant spread in PC2 is only seen after the TSE, as many more conformations are accessible in the unfolded state.

