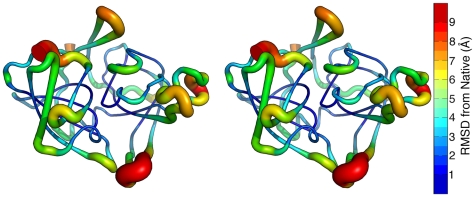
Figure 6. The structure of the αLP TSE.
Deviations from native in the αLP TSE are restricted to several regions, mostly in the domain interface. Stereo view of the average Cα RMSD at each residue in the PCA landscape TSE from the crystal structure mapped onto the crystal structure. Both the thickness of the cartoon and the color indicate the deviation from native, with thicker representations meaning larger deviations.

