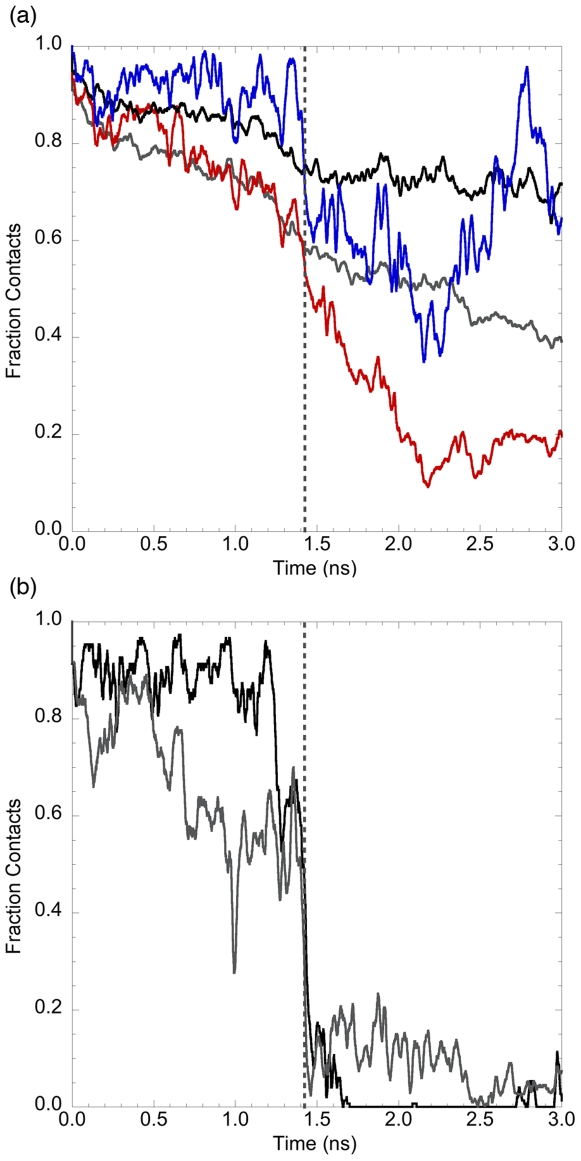
Figure 7. Contacts at the domain interface are preferentially broken at the unfolding transition.
(a) The fraction of intra-domain (black), inter-domain (blue), native intra-domain (gray), and native inter-domain (red) are shown for the first 3 ns of 500K1. Inter-domain contacts experience a sharp drop at the native cluster exit (dashed vertical line, 1.41 ns) and continue to decline. Intra-domain contacts are lost more gradually. Shortly after unfolding, ∼90% of native inter-domain contacts are lost permanently. (b) The fraction of native domain bridge-domain bridge (black) and native domain bridge-other (gray) contacts for the first 3 ns of 500K1. Both decline sharply at the native cluster exit (dashed vertical line) and do not return to native-like values. For both (a) and (b), the data is smoothed with a 0.019 ns running average.

