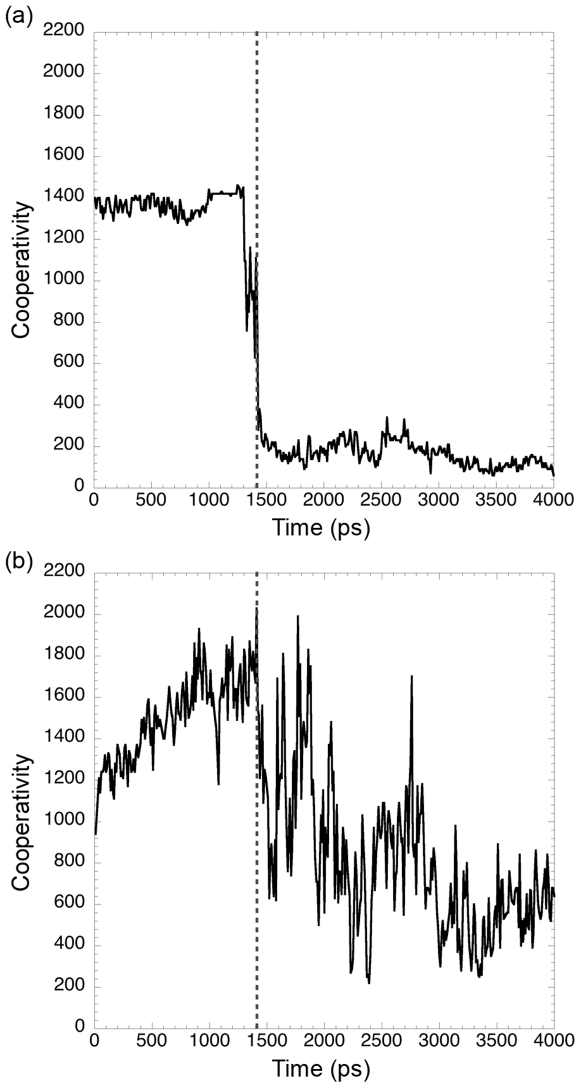
Figure 8. αLP unfolds significantly more cooperatively than trypsin.
Cooperativity is measured by counting the number of sampled conformations <3 Å Cα RMSD (two-fit Cα RMSD, see Methods) from the conformation at each time point. (a) Cooperativity for the first 4 ns of 500K1. Starting flat and steeply dropping indicates a very cooperative unfolding transition for αLP. (b) Cooperativity for the first 4 ns of 500K2T (trypsin). Trypsin unfolds much less cooperatively than αLP, as seen by the gradual rise early in the simulation and the gradual and noisy decline starting at 1.4 ns. (a) and (b) Vertical dashed line indicates position of the native cluster exit in each simulation.

