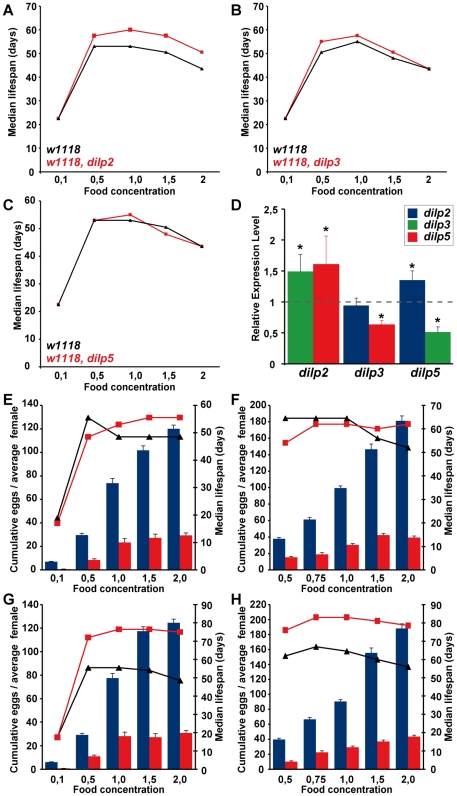
Figure 7. Dietary restriction in Drosophila is mediated by DILPs.
(A–C) dilp 2, 3 or 5 single mutants exhibit a normal response to DR compared to wild type controls. (D) Compensatory regulation among MNC-expressed DILPs on a high yeast diet. Expression levels of DILP2, 3 and 5 were measured by Q-RT-PCR on RNA extracted from heads of 10 day old dilp mutant females kept on 2.0x food. * p<0.05. (E–H) In two independent trials dilp2–3,5 mutants failed to show a normal response to DR. (E,F) wDahT; dilp2–3,5 mutants (Wolbachia-). (G,H) wDah; dilp2–3,5 mutants (Wolbachia+) Bars: index of lifetime fecundity±standard error of mean; connected points: median lifespan in days. dilp2–3,5 mutants in red, wDahT controls in black/blue.

