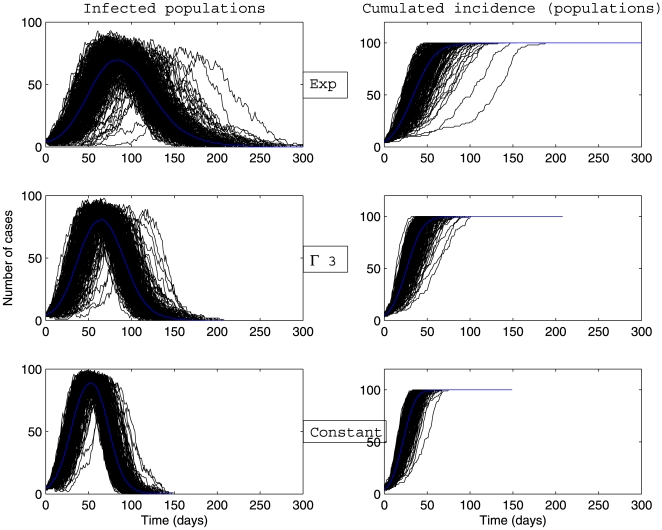
Figure 4. Dynamics of infected populations and cumulative incidence (in number of populations) described by a stochastic metapopulation model based on a completely connected network.
Early extinct trajectories were not considered. The mean (blue curve) was calculated over major epidemics only (corresponding to a final attack rate greater than 5 ). Simulations are performed using a time-continuous event-driven approach with
  Exp(
Exp( ) (top panel),
  (middle panel) and
  (bottom panel). Parameters values are given in the subsection Examples of Results.

