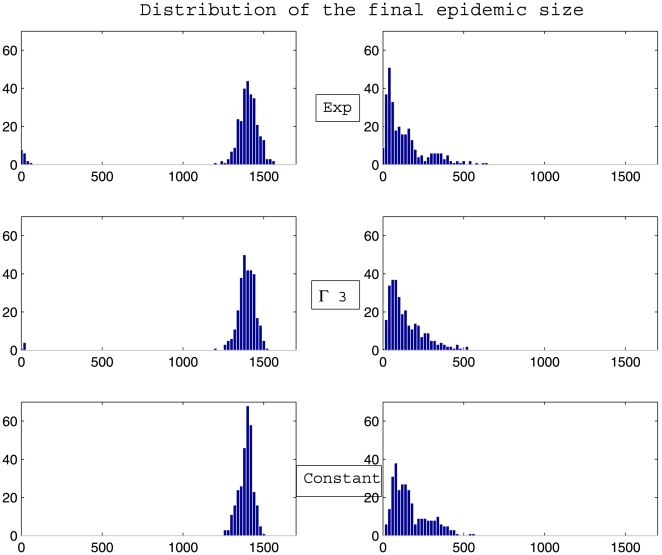
Figure 7. Distribution of the final epidemic size.
Calculation was performed on 300 simulations of a stochastic metapopulation model based on a completely connected graph (left panel) and on a scale-free network with mean degree of connectivity equal to 10 (right panel), with  Exp(
Exp( ) (top graphs),
  (middle graphs) and
  (bottom graphs). Parameters values are given at page 10.

