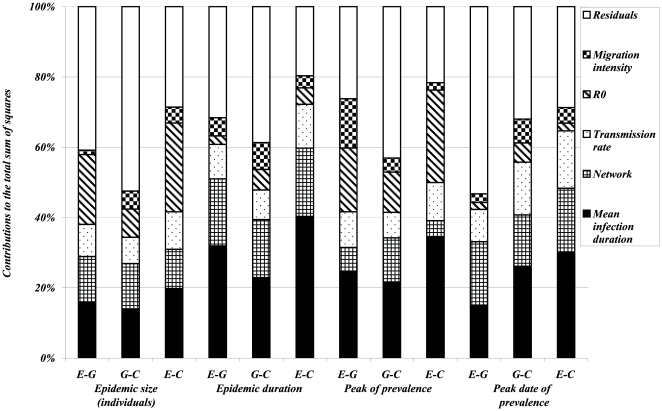
Figure 8. Results of ANOVA on 960 simulated scenarios of epidemic spread with parameter values given in Table 2.
Dependent variables (on x-axis) are logarithm of means (over the non early extinct dynamics) of global variables (directly referring to individuals regardless of their population of origin): size and duration of the epidemic, size and date of the epidemic peak. For each of these outputs three variants are considered with respect to the distribution of infection duration:  (difference between the value of the output simulated with the exponentially distributed infectious period and the value corresponding to the gamma distributed infectious period),
  (difference between the value of the output simulated with the gamma distributed infectious period and the value corresponding to a constant infectious period) and
  (difference between the value of the output simulated with the exponentially distributed infectious period and the value corresponding to a constant infectious period). Different pattern fills correspond to contributions of five input factors (mean infection duration, network, transmission rate,
  and migration intensity) to the variation in outputs amongst scenarios.

