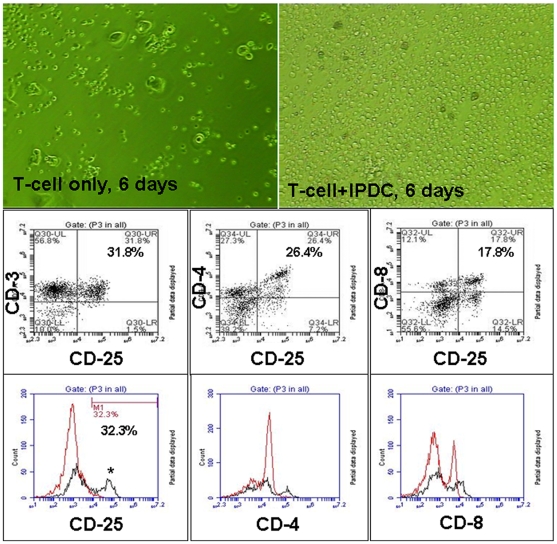
Figure 2. Morphological and phenotypical changes in T-cells during sensitization.
Upper panel: Culture of cord blood derived T-cells in the absence (left) or presence (right) of U251 cell lysate primed irradiated DC (PIDC). T-cells were cultured in RPMI-1640 media containing 10% FBS and IL-2 for 6 days. Note the number and morphology of the sensitized T-cells (right). Middle panel: Dot plot analysis of flow cytometric data of the CTLs showing activated T-cells (CD25) that are also both CD4 and CD8 positive. Lower panel: Flow-cytometric analysis (histogram plot) of T-cells cultured in the absence (red line) and presence (black line) of PIDC for day 6. Note the higher number of CD4+, CD8+ and CD25+ T-cells on day 6. There were a significantly (p = 0.006) higher number of activated T-cells on day 6 in the presence of PIDC.

