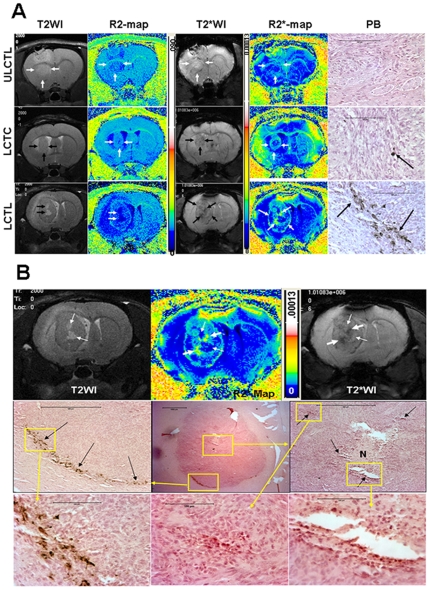
Figure 4. MRI and Prussian blue positive cells in tumors.
Figure 4A: T2-weighted and T2*-weighted images and their corresponding R2 and R2* maps and DAB enhanced Prussian blue staining from representative animals that received unlabeled CTL (ULCTL, upper row), labeled control T-cells (LCTC, middle row) and CTL (LCTL, lower row). Both T2W and T2*W images show well established tumors in the brain, however, low signal intensity areas were only seen in tumors that received LCTC and LCTL. Corresponding R2* maps show high signal intensity areas. Animals that received LCTL show high signal intensity areas both at the peripheral and central part of the tumors (arrows). Corresponding DAB enhanced Prussian blues staining show multiple Prussian blue positive cells in tumors that received LCTL (arrows). There are a few Prussian blue positive cells seen in tumor that received LCTC (arrow). No definite Prussian blue positive cells were seen in tumor that received ULCTL. Areas of necrosis can easily be identified by comparing T2WI and R2 maps (thick arrows) in tumor that received LCTL (lower row). Bars on the images measure 100 µm. Figure 4B: Detailed histological analysis of the tumor that received LCTL. Bars on the images measure 100 µm. Upper panel: T2-weighted image (T2WI) and T2*-weighted image (T2*WI) show areas of necrosis (high signal intensity on T2WI and T2*WI and low signal intensity on R2* map). Thin arrows show the sites of necrosis and thick arrows show possible site of accumulated iron positive cells. Middle panel: Representative histological section with similar tumor orientation (within the constraints of the experimental limitations, i.e. 1 mm thick MRI slices versus 10 µ thick histological section) show central necrosis (N) in the tumor with areas of iron positive cells (black arrows) seen in the central and peripheral part of the tumor that received iron labeled CTLs. Lower panel: Enlarged view of the boxed areas.

