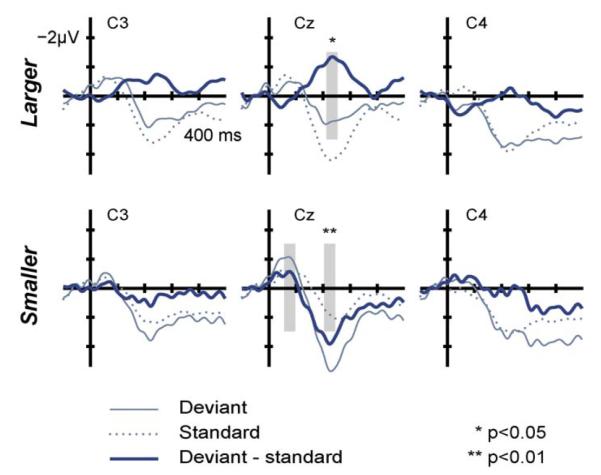
Fig. 5.
Grand-average (13 neonates) ERPs elicited by standard (thin dotted lines) and deviant (thin solid lines) sounds for larger (top row) and smaller (bottom row) resonator-size at three electrode locations (C3, Cz, and C4). Deviant-minus-standard difference ERPs are shown in thick lines. Stimulus onset is at the crossing of the axes. Time windows for the amplitude measurements are indicated by grey shading with asterisks marking significant differences between the standard and deviant responses (*p < 0.05; **p < 0.01).

