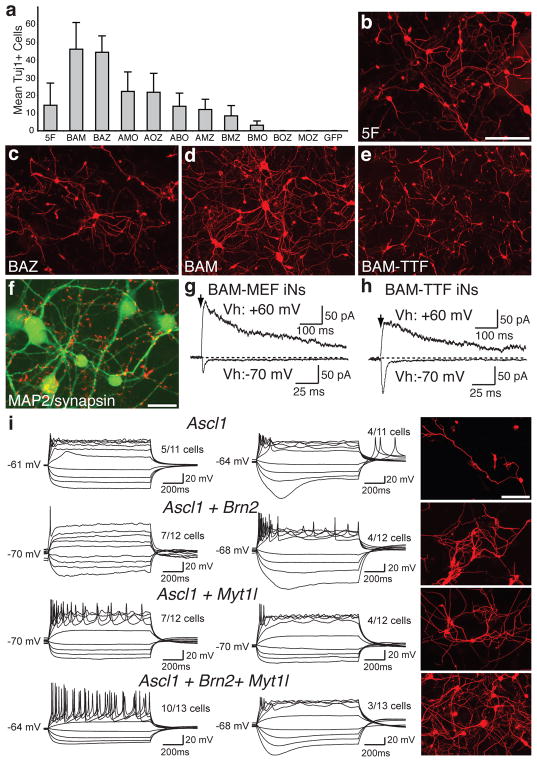
Figure 5. Defining a minimal pool for efficient induction of functional iN cells.
a, Quantification of Tuj1-positive iN cells from TauEGFP MEFs infected with different 3-factor combinations of the five genes. Each gene is represented by the first letter in its name. Averages from 30 randomly selected visual fields are shown (error bars= ± S.D.) b–d, Representative images of Tuj1 staining of MEFs infected with the 5F (b), Ascl1+Brn2+Zic1 (ABZ) (c) and Ascl1+Brn2+Myt1L (BAM) (d) pools. e, Tuj1 staining of perinatal TTF-iN cells 13 days after infection with the BAM pool. f, BAM-induced MEF-iN cells express MAP2 (green) and synapsin (red) 22 days after infection. g, Representative traces of synaptic responses recorded from MEF-derived BAM (3F)-iN cells co-cultured with glia after isolation by FACs. Vh: holding potential. At Vh of −70 mV, AMPA R-mediated EPSCs were recorded; at Vh of +60 mV, NMDA R-mediated EPSCs were revealed. h, Synaptic responses recorded from TTF-derived 3F-iN cells. Scale bars in (h) apply to traces in (g). i, Representative traces of action potentials elicited from MEF-derived iN cells transduced with the indicated gene combinations, recorded 12 days after infection. Cells were maintained at a resting membrane potential of ~−65 to −70mV. Step current injection protocols were used from −50 to +70 pA. Traces in each subgroup (left or right panels) represent subpopulations of neurons with similar responses. Numbers indicate the fraction of cells from each group that were qualitatively similar to the traces shown. Right panels: representative images of Tuj1 staining after recordings from each condition. Scale bars = 20 μm (f) and 100 μm (b,i).

