
Figure 2.
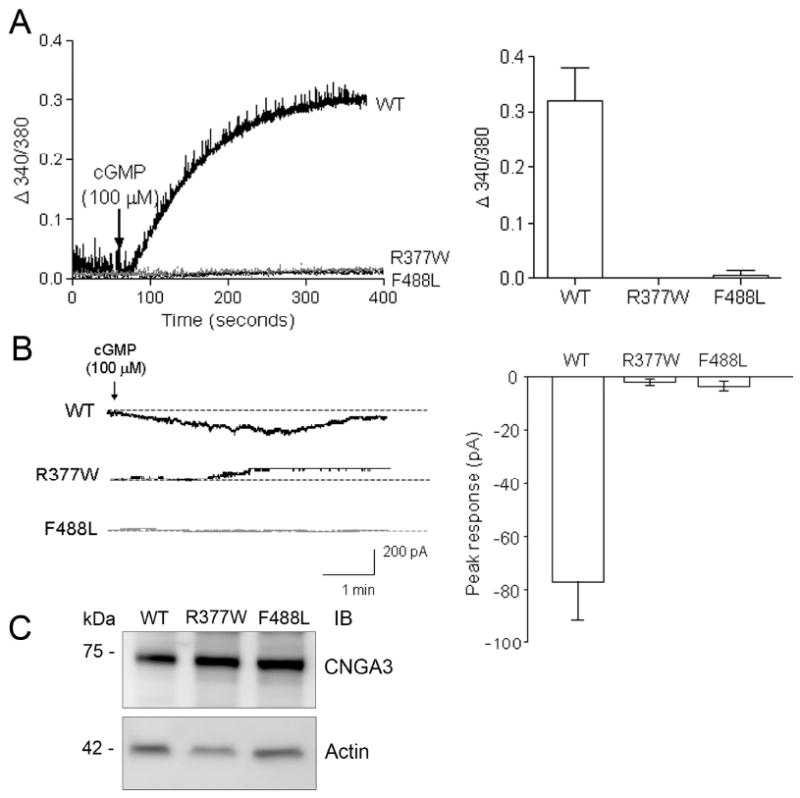
The R377W and F488L mutations cause loss of channel activity. (A). Intracellular calcium responses of HEK293 cells expressing the WT-CNGA3, R337W-CNGA3, and F488L-CNGA3 in response to 8-pCPT-cGMP (100 μM) stimulation. The left panel shows the representative response curves and the right panel is the bar graph showing the quantitative analysis of the calcium measurement (at 300 s after cGMP stimulation) from 4-5 independently performed experiments. (B). Electrophysiological recordings of HEK293 cells expressing the WT-CNGA3, R337W-CNGA3, and F488L-CNGA3 in response to 8-pCPT-cGMP (100 μM) stimulation. The recordings were performed using gap-free protocol with a holding potential at −50 mV. The left panel shows representative patch-clamp recording profiles and the right panel is the bar graph showing the quantitative analysis of peak amplitude in response to 100 μM 8-pCPT-cGMP (WT n = 18, R377W n = 13, and F488L n = 9). (C). Western blot detection of expression of the WT-CNGA3, R337W-CNGA3, and F488L-CNGA3 in HEK293 cells that had been transfected with the respective cDNAs. Cellular protein extractions were resolved on 10% SDS-PAGE, followed by Western blotting using the polyclonal anti-CNGA3 antibody.