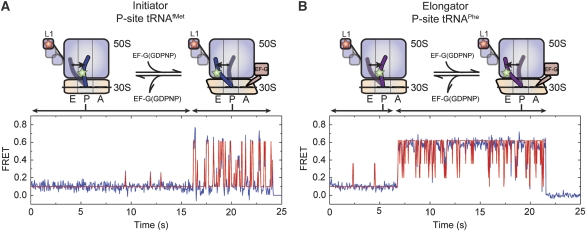
Figure 4.
Direct observation of dynamic mode switching observed in smFRET trajectories. Ribosome complexes with labelled L1 and either (A) P-site tRNAfMet or (B) P-site tRNAPhe show dramatic switches in the dynamic mode of the L1 stalk in the presence of intermediate EF-G concentrations (0.1–1 μM). These trajectories represent a minority of molecules (∼1–4%), consistent with slow EF-G binding and release relative to the observation window (∼30sec). FRET traces are shown in blue with idealization, estimated by HMM analysis (Qin, 2004), overlaid in red.

