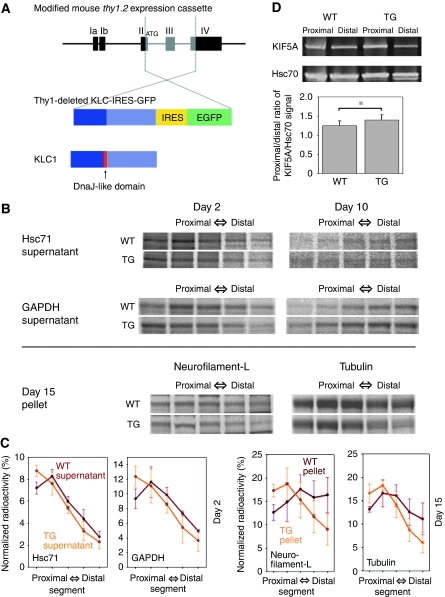
Figure 5.
Transgenic mice generation and axonal transport analysis in their optic nerve axons. (A) Vector construction for the transgenic mice. Thy1-deleted KLC-IRES-GFP expresses KLC in which the DnaJ-like domain is deleted and GFP bicistronically under the control of the thy1.2 promoter. (B) Slow axonal transport profile analysed by metabolic-labelling studies. We injected 35S methionine into the vitreous bodies of mouse eyeballs. After 2, 10 or 15 days, consecutive serial segments of the optic nerves were processed. WT (upper panels) and TG (lower panels) show the results for the wild-type and transgenic mice, respectively. The results of supernatants of Hsc71 and GAPDH at day 2/10 and pellets of neurofilament (L; low-molecular weight) and tubulin at day 15 are shown. (C) Profiles of specific bands based on the results shown in (B). Bars show the standard deviation. (D) Fast axonal transport analysed by sciatic nerve ligation studies. We ligated sciatic nerves, and 6 h later, collected nerve segments (3 mm) proximal and distal to the ligature. Sciatic nerve segments were analysed by western blot. WT (left panels) and TG (right panels) show the results for the wild-type and transgenic mice, respectively. The proximal/distal ratios of KIF5A (fast axonal marker)/Hsc70 (internal control) signal were 1.254±0.123 (n=8) for wild-type mice and 1.404±0.135 (n=8) for transgenic mice.

