
Figure 3.
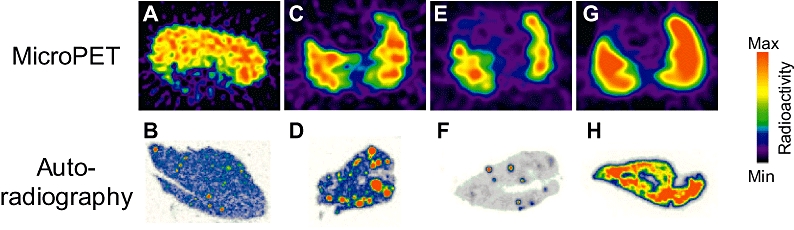
MicroPET images showing localized distribution of radioactivity in liver (A) and lung (C) after [18F]-big ET-1 administration in control rats. This was corroborated by autoradiography of ex vivo tissue sections of liver (B) and lung (D) confirming that the radioactivity was localized to the vasculature. For comparison, data from Johnström et al. (2005a) are shown where a comparable localized distribution in the lung was observed when the ETB receptor had been blocked using the ETB antagonist BQ788 prior to infusion of [18F]-ET-1: (E) Micropet image of the lung and (F) corresponding autoradiography of ex vivo tissue section. The Micropet image of [18F]-ET-1 binding in the control rat lung is shown in (G) together with the corresponding autoradiography of ex vivo tissue section (H). ET-1, endothelin-1; PET, positron emission tomography.