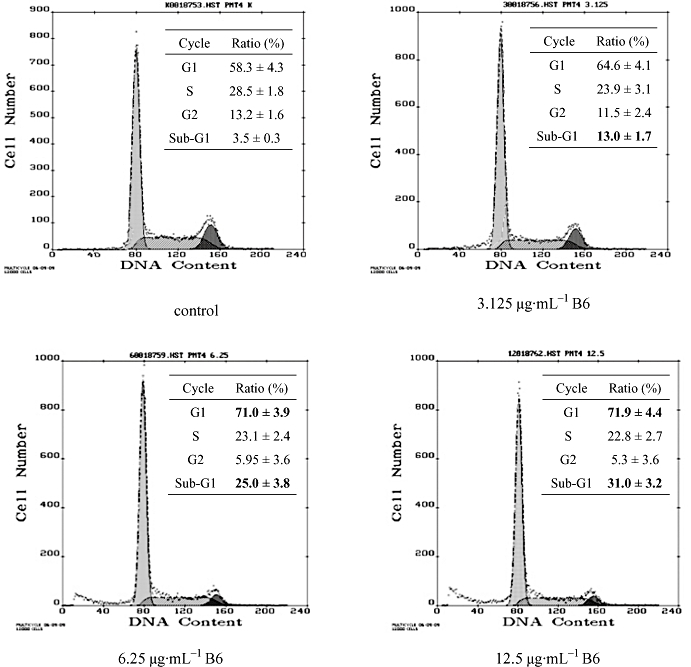
Figure 3.

Cell cycle distribution of HeLa cells exposed to B6. HeLa cells were treated with B6 for 24 h followed by PI staining and FACScan flow cytometer analysis. Numbers in bold type correspond to significant variations compared with control. Results represent the mean ± SD, n= 3. B6, N-(4, 5-dibromo-pyrrole-2-carbonyl)-L-amino isovaleric acid methyl ester; PI, propidium iodide.
